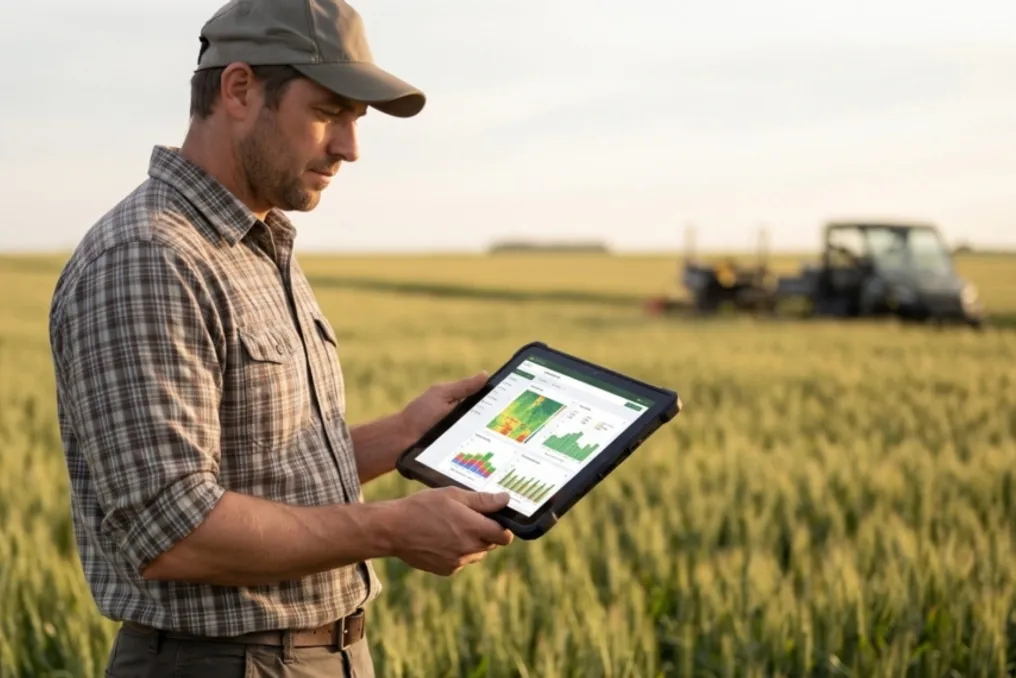
How to turn collected data into management decisions in agriculture
Read more
Food For Mzansi
foodformzansi.co.za

How to turn collected data into management decisions in agriculture

After collecting data, the next question arises: what to do next? In a previous article, Agritistics discussed which indicators are most important on the farm and why reliable records are the foundation of effective management. The second article examined the transition of farmers to structured digital systems. Now the focus shifts to what happens after the data collection process itself.

Many farms accumulate huge volumes of data. Nevertheless, despite this, many farmers still find it difficult to quickly answer important management questions. The reason is that the data itself has limited value; the true significance lies in the subsequent actions. This process can be seen as a path: data transforms into information, information into understanding (insight), and understanding leads to decision-making. Each stage brings the farm closer to higher quality management, increased efficiency, and improved profitability.

Data represents raw material consisting of individual recorded observations and facts. For example, this could be a pig's weight of 85 kg, feed consumption of twelve tons, rainfall for a month—45 mm, or mortality rate—3%. Although each of these figures may be accurate, individually they reveal only a small part of the picture. One indicator rarely provides enough context for making management decisions, so data collection should never be the final goal, as it is only the initial stage.

Information is formed when data is organized, structured, and placed in a specific context. If a growing and fattening unit records feed consumption and weight gain, viewing these indicators in isolation offers little benefit. However, when they are combined to calculate the feed conversion ratio, the data becomes information. An analogous principle applies throughout the agricultural sector: yield per hectare, mortality percentage, cost per kilogram of product, and average daily gain—all are examples of information. The farmer stops merely recording activities and starts measuring productivity.

Information turns into understanding (insight) when patterns, relationships, and trends begin to emerge. Imagine that mortality is increasing over three consecutive production cycles. Information reports the increase in mortality. Insight arises when the question is asked: is the mortality related to a specific housing sector, have weather conditions changed, has the feed supplier changed, or does one genetic line show different results than another? Understanding helps identify factors affecting productivity, whether positive or negative.

At this stage, visualization becomes an extremely powerful tool. Trends that are difficult to notice in spreadsheets often become obvious through dashboards, graphs, and reports. Effective visualization allows management teams to recognize problems earlier, focus attention on the most important aspects, and find opportunities that might otherwise go unnoticed. The goal is not to create attractive diagrams, but to answer a much more important question: why is this happening?

Decision-making is the moment when the entire value of the process is realized. Neither data, nor information, nor understanding improves productivity by itself; it is the decision-making that does. Once the reasons behind the numbers are understood, farmers can act. For example, they can decide to adjust feeding strategies, revise health protocols, study feed losses, optimize irrigation schedules, or invest in infrastructure improvement.

Some decisions will bring immediate benefits, while others may not yield the expected result. In any case, future records will show the impact of these decisions, creating a cycle of continuous improvement. The farm must measure, understand, decide, and measure again.

Turning Data into a Competitive Advantage

The farms that benefit most from data are not necessarily those with the most complex technology. They are the farms that consistently transform quality records into concrete actions. Good data systems help management spend less time searching for information and more time analyzing performance. They create a single source of reliable information, improve internal business communication, and simplify monitoring progress against set goals.

In the agricultural sector, characterized by rising resource costs, market volatility, and increasing pressure on profitability, the ability to make informed decisions has become a significant competitive advantage. Data collection is important, and digitizing this data is the next step. However, the true value emerges when records become information, information becomes understanding, and understanding leads to better decisions. Only then do data cease to be administrative routine and become a management tool. Agritistics helps farmers go through this journey by structuring data, centralizing information, and creating meaningful visualizations that transform farm records into actionable management intelligence.
Similar stories

Overview of Agricultural Events Scheduled for November 16 to 20
Read more
foodformzansi.co.za

Overview of Agricultural Events Scheduled for November 16 to 20

Despite the approaching end of the year, farmers can attend a series of events before the holiday break begins. These events are scheduled from November 16 to 20.

On Monday, November 16, in Lupeng village, Kuruman, Northern Cape, Agriman Farming and Projects will host Farmer's Day. The purpose of this day is to express gratitude to farmers for their dedication to working with the land and to highlight the important role they play in local communities. The event, organized by Rebane Haai, will allow farmers to socialize, share experiences, and learn about various alternative opportunities in agriculture. Prizes and entertainment for families will also be provided. It should be noted that Farmer's Day will take place in March 2027, and the exact date has not yet been determined.

On Tuesday, November 17, Agritistics will hold a webinar titled 'From Notebook to Dashboard.' Data analysis and visualization specialist from Agritistics, Stefan Corbett, will present on the topic 'How small and growing farms can use data to make more informed decisions.'

On Wednesday, November 18, the Tulbach Agricultural Fair will take place. From Thursday, December 3, to Saturday, December 5, 2026, visitors can expect diverse activities, including family entertainment, various exhibitions and shows, performances by famous artists, a vineyard and restaurant, market stalls, and children's activities. Main attractions will include National Equestrian Championships and horse racing contests, bird and flower/field flower exhibitions, a youth fair, mechanical bull riding, and a vineyard, as well as live music and evening events.

Thursday, November 19, is dedicated to the Cape AgriTech Connect event. This event brings together the industry, researchers, innovators, and farmers from across the Western Cape to advance agricultural innovation in the region. The event will begin with a brief welcome and introduction of the cluster and its partners, followed by wine and lunch on the farm. It is a relaxed opportunity to meet participants in the agritech community, learn about participation opportunities, and hear plans for 2027. It will take place on November 19 in Blaauwklippen, Stellenbosch, from 11:30 to 14:00.

On Friday, November 20, there will be a weekly auction in Stenderton. Farmers from the Stenderton area are invited to the auction, where various types of livestock will be sold. All biosecurity measures will be observed in light of the Foot-and-Mouth Disease (FMD) outbreak. The auction itself is scheduled for November 27, 2026, from 11:00 to 16:00. For further information, please contact Eric Heymans.

Implementation of digital technologies, AI, and satellite monitoring to transform agriculture in India
Read more
www.aajtak.in

Implementation of digital technologies, AI, and satellite monitoring to transform agriculture in India

Agriculture in India is moving away from relying solely on plows, tractors, and weather conditions; digital technologies are beginning to fundamentally change the lives of farmers. Information regarding how much land a farmer owns, what crops they are growing, and the damage sustained by a crop on a specific field is now being collected using digital methods. This can facilitate more effective distribution of government programs, prevent errors during crop surveys, and enable timely consultation for farmers.

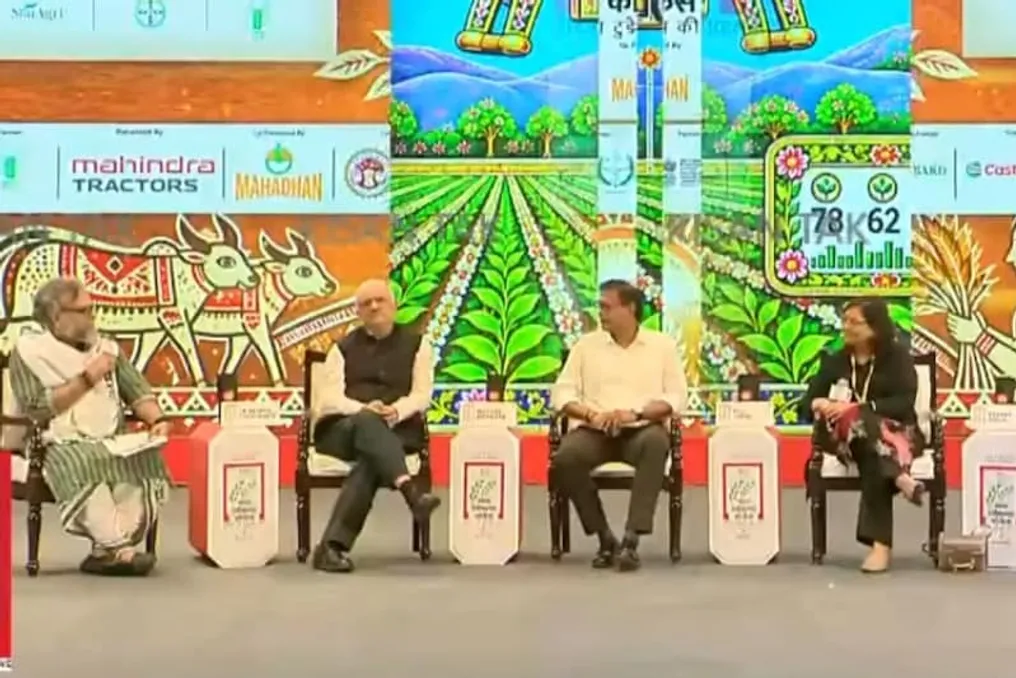
Experts presented exactly how digital technologies are transforming agricultural practices at the session 'Digital Farming: India Shows the Way,' organized by India Today Group at Bharat Mandapam in Delhi. The discussion included Dr. Devesh Chaturvedi, former Central Secretary for Agriculture, Nishant Varwade, Agricultural Secretary of the Madhya Pradesh government, Roli Jindal, co-founder and CEO of RSMI CropLitics, and agrarian influencer Paragat Singh.

Dr. Devesh Chaturvedi noted that the National Mission for Digital Agriculture is a step that will lead to significant changes in the agricultural sector. Under this mission, AgriStack is being developed, which includes three key systems: Farm Registry, Farmer ID, and Digital Crop Survey.

The Farm Registry system assigns a unique identifier to every field in the country, which can be considered a field number based on Aadhaar. Along with this identifier, the geographical location of the field—its latitude and longitude—is registered. This simplifies the determination of the field's location and the calculation of its area.

In the Farmer ID system, each farmer is issued a unique 11-digit identifier. Its database stores information such as the farmer's Aadhaar number, mobile phone number, land records, and the farmer's share in the field. According to Dr. Chaturvedi, since multiple family members often have rights to the same land with different shares, it is difficult to determine how much land actually belongs to each farmer. The digital farmer ID will make this information transparent, allowing farmers to view their own data independently, and relevant departments to use it only with the farmer's consent.

The third component is the Digital Crop Survey. Within this system, crop information is entered via a mobile application after visiting the field. The surveyor photographs the field and indicates which crop is planted there. Furthermore, satellite imagery can be used to identify crops, which reduces the likelihood of false data entry during crop assessment. Dr. Chaturvedi reported that approximately 110 million farmer IDs have been created so far, and the digital crop survey is being conducted for about 300 million parcels. Geo-tagging of about 80 percent of the parcels has also been completed.

Madhya Pradesh Agricultural Secretary Nishant Varwade stated that the digital agriculture mission has been implemented in the state in the form of a campaign. Out of approximately 110 million farmer IDs created across the country, about 11.3 million belong to Madhya Pradesh. He stated that work on farmer IDs and geo-tagging in the state is 100% complete. He clarified that this work was not limited only to the Department of Agriculture but also involved the Revenue Department and other agencies. As part of this campaign, the digitization of land records (Khasra-Khatauni), as well as pending cases related to land re-registration and division, were also included in the process.

According to Varwade, through AgriStack, benefits, including fertilizers and subsidies, are provided in Madhya Pradesh. Work is also underway to integrate data on dams and canals belonging to the irrigation department using digital mapping. This system can help reduce disputes that arise when several brothers or family members farm on the same land, concerning the receipt of fertilizer subsidies, sale of crops at the Minimum Support Price (MSP), or compensation for crop damage.

Roli Jindal, CEO of RSMI CropLitics, emphasized that using digital technologies in agriculture offers three main advantages: speed of information retrieval, the ability to monitor large areas simultaneously, and increased data accuracy. She explained that thanks to satellite data and machine learning, it is now possible not only to determine which crop is planted in a field but also to understand the overall condition of that crop. For example, during wheat cultivation in Uttar Pradesh, the increase in temperature at the end of March and early April affects the grain formation process.

However, this impact is not uniform across all fields. The company has developed models that allow satellite data to determine exactly which fields have been affected by disruptions in the wheat grain formation process. Roli Jindal added that improving these models requires data from different states, districts, and various crops. The more diverse and extensive the data the machine studies, the higher its capacity for recognition and prediction will be.

Popular