Beverage production in Uzbekistan grew by 11% over nine months
Read more
UzDaily
uzdaily.uz

Beverage production in Uzbekistan grew by 11% over nine months

According to the National Statistical Committee, major enterprises in Uzbekistan produced beverages worth 25.5 trillion soms from January to September 2026. This figure demonstrates an 11% growth compared to the same period last year.

The largest production volume was recorded in Tashkent, where the product value reached 14.9 trillion soms, accounting for more than half of the total national volume.

In the Tashkent region, enterprises produced beverages worth 4.1 trillion soms. This is followed by Khorezm region with a figure of 1.9 trillion soms and Samarkand region, which provided 1.6 trillion soms. Production in Namangan region amounted to 1.4 trillion soms.

In other regions, production volumes were significantly lower. Bukhara region registered production worth 414.2 billion soms, while Karakalpakstan produced beverages worth 378.9 billion soms.

Production in Kashkadarya region reached 177.8 billion soms, Fergana region — 162.8 billion soms, and Syrdarya region — 154.9 billion soms. Surkhandarya region produced 127.8 billion soms, and Andijan region — 114.4 billion soms. Total output in Jizzakh region amounted to 75.2 billion soms, and in Navoi region — 21.1 billion soms.

Similar stories

Electronics production in Uzbekistan has grown almost 30 times over the last decade
Read more
podrobno.uz

Electronics production in Uzbekistan has grown almost 30 times over the last decade

The volume of electrical engineering product output in Uzbekistan has shown significant growth, increasing from 1.7 trillion soums in 2016 to a projected 50 trillion soums by 2026. Over this ten-year period, $2 billion in investments were attracted to the industry, and 413 new production capacities were launched.

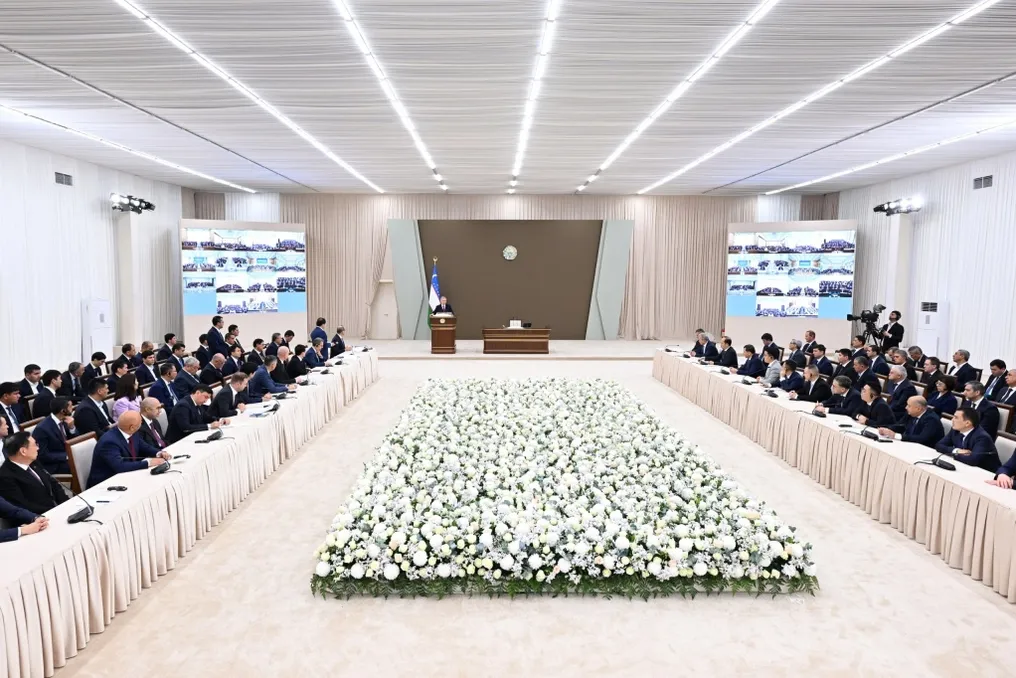
This data was presented during a meeting between President Shavkat Mirziyoyev and business and investor representatives. Enterprises have managed to master the production of over one hundred varieties of new products, including household appliances, solar panels, high-voltage transformers, and electronic meters.

This year, investments in the sector reached $600 million, and exports amounted to $1.6 billion. Meanwhile, imports from abroad increased fourteenfold during the reporting period.

Development Priorities and Raw Material Base

Despite the achievements, the head of state emphasized that existing production capabilities are not being utilized to their full extent. One of the key development areas recognized is increasing the output of high value-added products, especially through copper processing and the introduction of advanced technologies.

A third copper enrichment plant was launched in 2026. The implementation of this project will allow copper production to increase to 300 thousand tons, and to 500 thousand tons by 2030. Expanding the raw material base is intended to open up new prospects for local electrical equipment manufacturers.

Significant attention is paid to the field of renewable energy: by 2030, the capacity of energy storage systems in Uzbekistan is planned to be increased to 4.5 gigawatts. Nevertheless, it is noted that some necessary equipment is not yet produced domestically, although foreign partners are ready to use local products.

In the future, Uzbekistan intends to implement projects with partners in various sectors of the economy worth $450 billion. According to the president's estimates, this will ensure the creation of a large long-term market for electrical equipment producers.

Previously, the goal was set to increase exports of electrical engineering products to $5 billion by 2030, and the total production volume in this and related fields should reach $11 billion.

Capital of Uzbekistan's banks grew by 17.3% over the year, reaching 152.9 trillion soms
Read more
uzdaily.uz

Capital of Uzbekistan's banks grew by 17.3% over the year, reaching 152.9 trillion soms

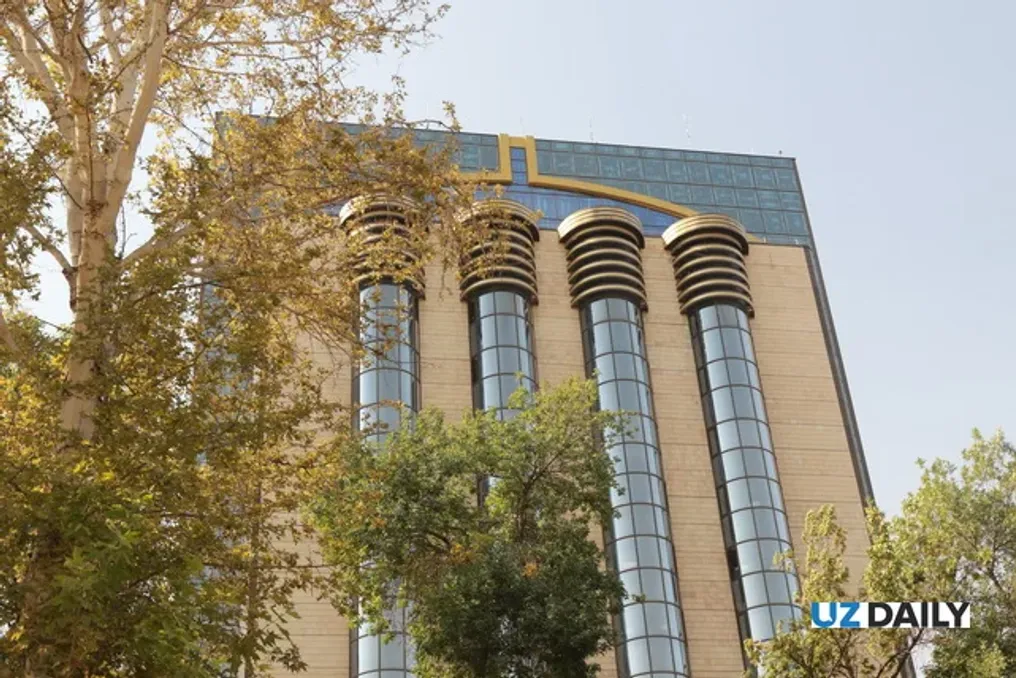
According to data from the Central Bank of Uzbekistan, the total capital of commercial banks in Uzbekistan reached 152.9 trillion soms as of October 1, 2026. This represents an increase of 17.3% compared to the same period last year, when the figure was 130.4 trillion soms.

The regulatory capital in the banking sector increased by 17.6%, amounting to 169.4 trillion soms. Since assets grew at comparable rates, the capital adequacy ratio remained virtually unchanged at 18.18%, compared to 18.19% the previous year.

Tier 1 capital adequacy indicators showed a slight decrease. The Tier 1 capital adequacy ratio was 14.99% compared to 15.06%, and the total Tier 1 capital ratio decreased to 14.61% from 15.02% previously.

Tier 1 capital increased by 17.6%, reaching 140.3 trillion soms, which accounts for 82.8% of the regulatory capital. Meanwhile, the total Tier 1 capital grew by 14.4% to 136.2 trillion soms. Additional Tier 1 capital increased almost elevenfold, rising from 0.38 trillion to 4.1 trillion soms.

Tier 2 capital increased by 20%, reaching 29.7 trillion soms. Profit was the main source of growth in banks' equity. Undistributed profit grew by 55.4% year-on-year, reaching 34.6 trillion soms, and its share in the total bank capital increased from 17.1% to 22.6%.

Shareholder capital increased by 9.6% to 101.2 trillion soms, while reserve capital grew by 10.6%, reaching 15.9 trillion soms.

Four banks had capital exceeding 10 trillion soms: National Bank of Uzbekistan with 21.2 trillion soms, Agrobank with 13.9 trillion soms, Uzpromstroybank with 13.1 trillion soms, and People's Bank with 11.5 trillion soms. Together they accounted for 39% of the total banking system capital, down from 42% the previous year.

Seven banks had capital in the range of 5 to 10 trillion soms, accounting for 33.8% of the total. Another eight banks had capital between 2 and 5 trillion soms, representing 18%. Five banks had capital from 1 to 2 trillion soms, and ten had capital from 500 billion to 1 trillion soms. Only one bank had capital below 500 billion soms, compared to four such banks the previous year.

Smaller banks demonstrated the highest capital buffers. The capital adequacy ratio among six banks with assets up to 3 trillion soms was 27.2%, and among six banks with assets from 3 to 10 trillion soms, it was 20.8%. Among the 12 largest banks, each with assets exceeding 30 trillion soms, this ratio was 17.6%.

Market services volume in Uzbekistan exceeded 1000 trillion soms in the first half of 2026
Read more
uzdaily.uz

Market services volume in Uzbekistan exceeded 1000 trillion soms in the first half of 2026

According to preliminary data from the National Statistical Committee, the volume of market services provided in Uzbekistan reached 1003.2 trillion soms at current prices for the period from January to September 2026. This figure demonstrated a real growth of 16.7% compared to the same period in 2025.

In the first nine months of 2025, market services amounted to 815 trillion soms, reflecting an increase of 14% relative to the same period in 2024. Statistical data for January-September 2025 and 2026 were adjusted after conducting population and agricultural censuses.

Service Distribution by Region

Tashkent accounted for 40.8% of the total volume of market services in the country, equivalent to 409.4 trillion soms. In the capital, the volume of services increased by 18.3% in real terms. Among the regions, Samarkand showed the largest volume of services—73.8 trillion soms, making up 7.4% of the national total. It is followed by Tashkent region with 68.3 trillion soms (6.8%), Fergana region with 66 billion soms (6.6%), and Andijan region with 51 trillion soms (5.1%).

The lowest volume of services was recorded in Syrdarya region—13.9 trillion soms, or 1.4% of the total volume. Outside the capital, the fastest growth in the service sector was observed in Samarkand region (17.3%), followed by Khorezm region (17.2%) and Andijan region (17.1%). Growth reached 16.9% in Navoi region, 16.8% in Syrdarya region, and 16.7% in Surkhandarya region. Kashkadarya and Tashkent regions showed growth at the level of 16.6%, and Fergana region—at 16.5%.

The volume of services grew by 15% in Namangan region and by 14.9% in Karakalpakstan Republic.

Services per Capita Level

The average volume of market services per capita across the country was 25.5 million soms, higher than the figure of 21.1 million soms the previous year; in real terms, this indicator increased by 14.7%. Tashkent demonstrated the highest per capita figure—126 million soms, representing an increase of 23.9 million soms compared to the previous year. Next are Navoi region with 19.7 million soms, Bukhara region with 18.8 million soms, and Tashkent region with 18.1 million soms. The lowest per capita figure was recorded in Surkhandarya region—10.4 million soms.

The fastest growth in services per capita was noted in Tashkent (16.4%), as well as in Khorezm and Navoi regions (both 15.3%). Namangan region showed the smallest growth rate (12.9%).

Contribution of Small Business and Service Structure

Small businesses provided services worth 567.5 trillion soms, accounting for 56.6% of the total national volume. At the same time, the volume of services provided by small enterprises grew by 17.4% in real terms. Fergana region has the highest share of small businesses in the total volume of services—76%. It is followed by Kashkadarya region (74.7%), Namangan region (74.4%), Andijan region (74.3%), and Surkhandarya region (73.7%).

In Tashkent, the share of small businesses in the service market was 42.9%, but the capital registered the largest volume of services provided by small enterprises, at 175.8 trillion soms, indicating a growth of 21.3%. In Bukhara region, small business services increased by 20.3%, while in Syrdarya region, this segment showed the lowest volume—9.1 trillion soms.

The main driver of overall growth was trade, financial, and transport services. Trade services grew by 17.4%, reaching 235.3 trillion soms, contributing 4 percentage points to the overall growth. Financial services increased by 22%, reaching 163.8 trillion soms, adding 3.4 percentage points, and transport services grew by 16.4% to 162.8 trillion soms, contributing 2.8 percentage points.

Accommodation and catering services grew by 11.3%, reaching 179.7 trillion soms, while information and communication services increased by 21.4%, amounting to 77.6 trillion soms. Educational services grew by 19.6%, and real estate services—by 15.3%. The greatest growth among the listed categories was shown by architectural, engineering-measuring, and technical testing, which grew by 24.2%.

Healthcare services increased by 14.2%, computer and household appliance repair grew by 11.1%, and rental services—by 9.5%.

In the overall structure of market services, trade accounts for 23.5%, accommodation and catering services—17.9%, financial services—16.3%, transport—16.2%, information and communication services—7.7%, and education—3.5%.

Since the beginning of 2026, statistics have been calculating the volume of trade services taking into account changes in inventories of goods intended for resale. The methodology was revised in accordance with the recommendations of international experts. A similar methodology was applied retrospectively to data for January-September 2025 to ensure comparability.

Statistics also provides a breakdown of individual service sectors. Catering services accounted for 96.1% of all accommodation and catering services. In the financial sector, insurance services accounted for 6.9%, auxiliary financial activities—7.3%, and other financial services made up 85.8%. Road transport accounted for more than half of all transport services, amounting to 52.5% or 85.4 trillion soms.

In the field of information and communication services, computer programming accounted for 48.4%, telecommunications—27.5%, information services—15.8%, and publishing activities—6.1%. Higher education covered 40.2% of educational services, while real estate rental and management accounted for 92.1% of real estate services. In healthcare, hospitals accounted for 32.3% of the total volume, medical practice and dentistry—14.4%, and other medical services—53.3%.

Popular