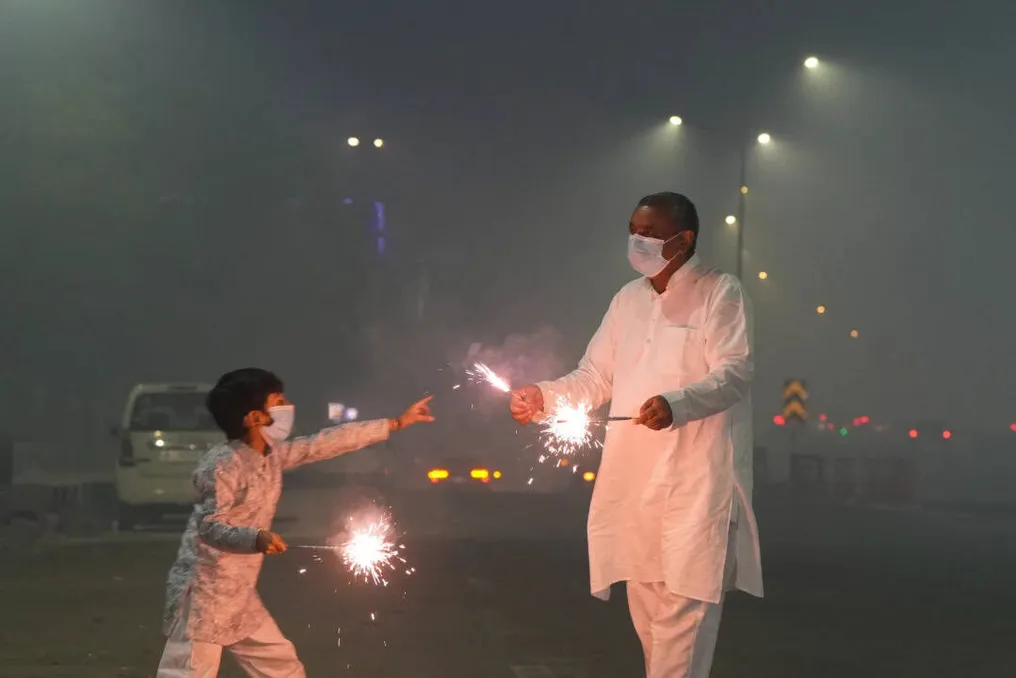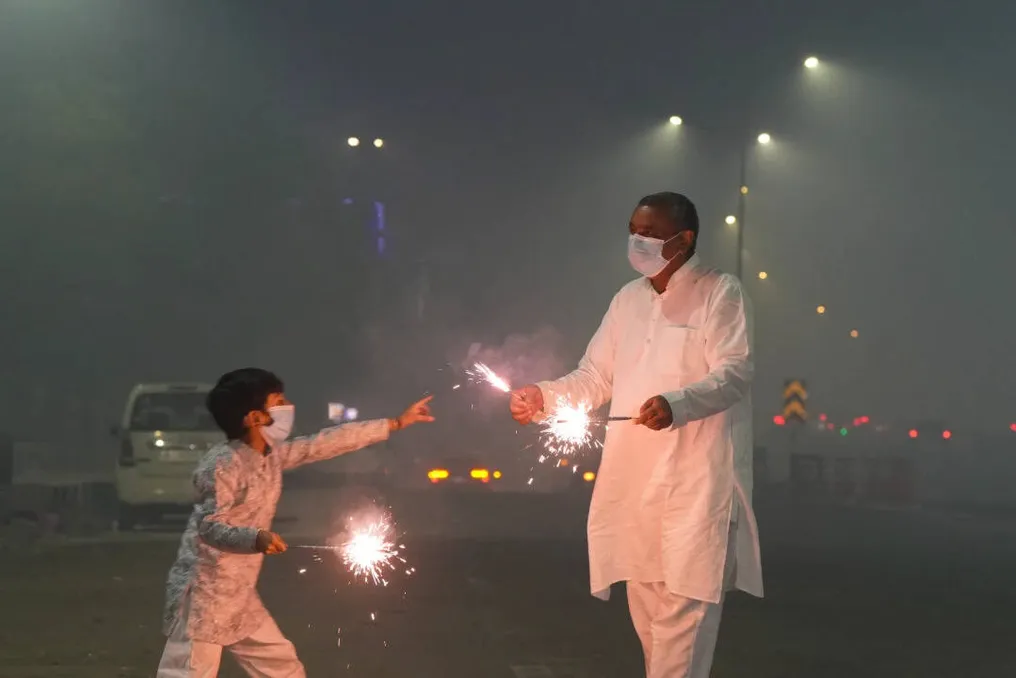
According to an analysis by the Centre for Research on Energy and Clean Air (CREA), missing data on PM2.5 readings from monitoring stations could have led to a 49% increase in the average pollution level in the city during the Diwali festival.
It was found that if the missing readings had been recorded at a level of 1000 micrograms per cubic meter (µg/m³), the average PM2.5 level in the city would have risen from 269 to 400 µg/m³. Meanwhile, the daily national standard for ambient air quality for PM2.5 is 60 µg/m³, and the WHO safe benchmark is 15 µg/m³.
This analysis was conducted one day after the Central Pollution Control Board (CPCB) reported that analyzers at its stations were calibrated to measure particulate matter concentrations only up to 1000 µg/m³ and could not display readings above this value for several hours during the night of Diwali.
CREA also noted that this data was not taken into account when calculating the average Air Quality Index (AQI). Analysts found that if the value of 400 µg/m³ had been adopted, the AQI on Monday would have risen from 344 (very poor) to almost hazardous. The AQI is calculated based on eight pollutants, including PM2.5.
As reported by TOI on Tuesday, the CPCB stopped providing particulate matter data during the peak pollution in the night of Diwali for several hours after pollutant levels at monitoring stations exceeded 1000 µg/m³. However, the Delhi Pollution Control Committee (DPCC), which manages 43 out of 60 stations, recorded levels exceeding 1000 µg/m³ during the Diwali night. At least 11 sites had an hourly PM2.5 concentration above 2000 µg/m³, and four had it above 3000 µg/m³.
The CPCB collects data from all 60 stations and publishes the AQI. It was noted that one station has not been functioning for the last few months. The latest analysis covered hourly PM2.5 data from 59 monitoring stations between 16:00 on November 8th and 16:00 on November 9th, corresponding to the 24-hour averaging period used for the CPCB's AQI bulletin on November 9th. A total of 1416 hours (24 hours x 59 stations) were analyzed.
The study revealed that 255 out of 1416 expected station-hours, or 18%, were missing. CREA performed a sensitivity analysis by assigning these data a value of 1000 µg/m³, which is the upper measurement limit specified by the CPCB for particulate matter. Under this scenario, the average PM2.5 concentration across all expected observations increased from 269 µg/m³ to 400 µg/m³, representing a 49% rise.
CREA stated: