India's GDP revision reveals underestimated contribution of unpaid female labor
Read more
YourStory [india, en]
yourstory.com

India's GDP revision reveals underestimated contribution of unpaid female labor

India revised its GDP calculation base, setting it for the period 2022–2023 in February 2026. New data sources were integrated into India's National Accounts, allowing for a reassessment of the size of the informal economy. This process demonstrated that economic indicators are not static, as they change when the statistical system decides to account for certain activities in greater detail.

In the same quarter, India's economy showed growth of 7.8%, enabling the country to maintain its status as the fastest-growing major economy despite the imposition of strict US tariffs and disruptions in the Strait of Hormuz. Although newspaper headlines noted this success, a significant portion of the work remained uncounted in the calculations—this is unpaid domestic and care work, which makes any other employment possible.

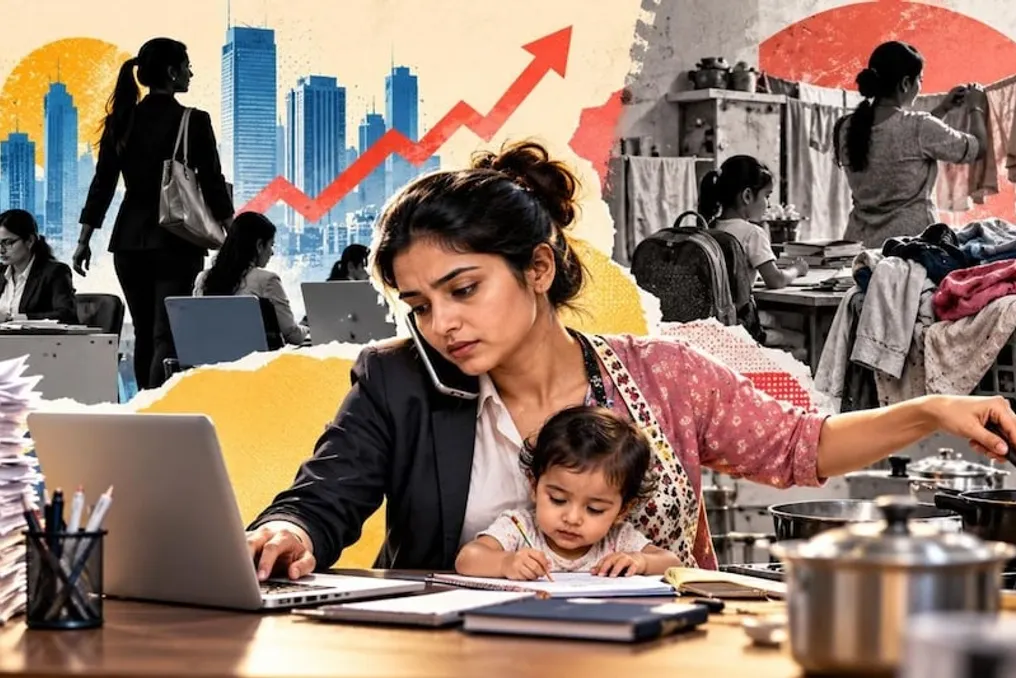
GDP has clear boundaries of production, and this is justified: for example, a kindergarten worker who receives pay for childcare is counted as economic activity, whereas a mother or grandmother performing this work for free is not. However, the value of this activity does not disappear; only the form of payment changes.

The volume of activity outside these boundaries is quite significant. According to the India Time Use Survey for 2024, women aged 15 to 59 spend approximately 201 minutes more per day than men on unpaid housework. A deeper analysis of unit-level data shows that women spend 343 minutes daily on unpaid domestic and care work, while men spend 43 minutes. Furthermore, about 93% of women engage in this labor, compared to 44% of men.

A study by the Ministry of Women and Child Development estimates this labor at up to 34.5 lakh crore, which accounts for approximately 15–17% of the GDP at average weighted wages. Even the Ministry of Statistics' time use report acknowledges that excluding unpaid services causes the GDP to 'significantly underestimate the nation's total income.'

The international solution is not to abandon GDP but to add supplementary accounting that measures activities outside production boundaries. India already possesses the necessary elements: two national time use surveys, an adopted valuation method, and a statistical system that has just demonstrated its ability to revise its figures. The only missing piece is the decision to act.

The visibility of this labor is important because governments allocate funds based on the metrics they measure. According to the UNDP, 44.5% of women in India not in the workforce cite childcare and homemaking as the main reason. Meanwhile, female labor force participation has risen from 23.3% in 2017–2018 to approximately 40% in 2025, according to Periodic Labour Force Survey data. However, the volume of unpaid work by women has barely changed over five years.

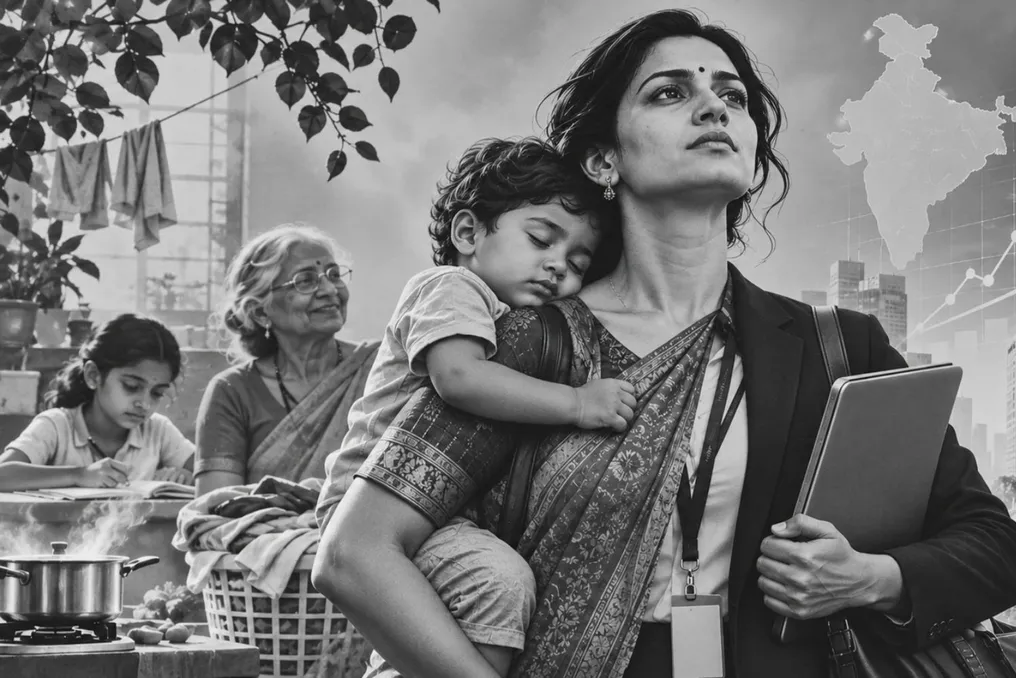
A woman who takes paid work while continuing to perform the same workload at home is not freed up for work; she has taken on a second shift. The real policy question is not how to convince more women to work, but what infrastructure will make paid work compatible with caregiving.

This contradiction is reflected in the government's own documents. The chapter on employment in the Economic Survey calls the care economy a promising source of jobs, and the Economic Survey 2025–2026 aims to achieve 55% female labor force participation. Nevertheless, under the Palna scheme, only 11,395 Anganwadi-Plus kindergartens were approved against a target of 17,000 by March 2025. Less than 10% of Anganwadi centers are located in cities where female participation is lowest.

This shortfall does not mean the scheme has failed. It indicates that care infrastructure is still being built while the country sets ambitious employment goals. If policymakers want to achieve real growth in paid female labor, childcare must stop being a secondary program and become part of labor market policy.

According to harmonized ILO estimates, female labor force participation in India was 32% in 2025. This figure is lower than in the PLFS because the ILO uses a different, internationally comparable definition. Among working-age women, participation reaches 85% in Japan and 78% in the United States.

These differences are the result of policy decisions, not chance. Japan increased the share of fathers taking parental leave from 17.1% to 30.1% in just one year, providing pay for it. Bangladesh, having a small share of India's exports, increased preschool coverage from 19.7% in 2018 to 28.5% in 2023 through targeted efforts to bring women into the workforce. The United States learned the opposite lesson: working-age women reached a record level of participation, after which growth among mothers of young children stalled due to a lack of affordable childcare.

No country has transitioned from developing to developed while leaving half of its working-age women outside the paid economy. The path to Viksit Bharat must account for them, otherwise, it will not be achieved.

There are three key areas of action: 1. Measure. A satellite accounting of unpaid care work linked to the Time Use Survey must be created and regularly published. It should show the value of this work, who performs it, where it is concentrated, and how it changes. The goal is not to artificially inflate GDP but to provide planners with a second panel of data for decision-making. 2. Invest. The UNDP estimates that spending around 2% of GDP on care services could create over 11 million jobs. As India urbanizes, fertility rates decline, and family sizes decrease, the question of who provides care becomes economic, not just domestic.

3. Reclassify. Care expenditures should be assessed not only in terms of social welfare but also in terms of their impact on employment, labor supply, and productivity. If a childcare center allows twenty parents to remain employed, its value cannot be measured solely by the number of children it serves.

This argument extends beyond feminist economics. A working paper by the Economic Advisory Council to the Prime Minister this year calls for moving care 'from private burden to social and economic infrastructure.' The diagnosis has been made, and the evidence supports it. The more complex question is whether measurement, budgeting, and implementation will follow.

The 2026 base revision showed that India's statistical system is capable of questioning long-held assumptions. This same willingness must now extend to work that supports the economy from outside its markets. This means collecting real-time data, publishing satellite accounting of unpaid care linked to the Time Use Survey, and viewing care infrastructure as measurable public investment. Every new kindergarten, elderly care service, and public care program must be evaluated not only by the people it serves but also by the paid work it enables.

If India wants to increase the share of women in the workforce, it must budget for the care that makes their work possible. India has demonstrated that it can re-measure its economy. Now it needs to build the care that will allow more women to participate in it.
Similar stories

47% of Indian taxpayers earn income beyond their main salary, according to ClearTax report
Read more
business-standard.com

47% of Indian taxpayers earn income beyond their main salary, according to ClearTax report

Wealth creation in India is increasingly moving beyond traditional salaries. According to the annual ClearTax report titled 'How India Reported in 2026', nearly half of individual taxpayers report income from sources such as investments, business, freelancing, and cryptocurrencies.

The proportion of self-declarants who reported having at least one source of income outside employment increased to 47.3% in the Assessment Year (AY) 2026-27, up from 9.5% in AY 2022-23. This reflects the growing diversification of family income sources.

This trend is also visible in the rise in the number of taxpayers declaring multiple sources of income. The share of self-declarants reporting income from two or more non-salary sources grew from 3.5% in AY 2022-23 to 24.4% in AY 2026-27.

The data suggests that investing, trading, and independent professional activities are becoming a more significant part of how Indians accumulate wealth, rather than relying solely on monthly salaries.

The increasing complexity of income sources is also reflected in tax filings (ITR). Declarations going beyond the basic ITR-1 accounted for 62% of all filings in AY 2026-27, higher than 53% in AY 2025-26 and 40% in AY 2024-25.

Furthermore, ITR-2 and ITR-3, which cover taxpayers with capital gains and other complex income sources, together made up 57.2% of total declarations in AY 2026-27, an increase from 48.1% the previous year and 36.2% in AY 2024-25.

Capital Gains Reporting Rises Sharply

One of the most significant findings is the increase in the number of taxpayers reporting capital gains. The share of self-declarants declaring capital gains reached 41.7% in AY 2026-27, up from 34.4% in AY 2025-26, marking an increase of 7.3 percentage points in one year. Two years ago, this figure was only 25.5%.

This trend indicates growing participation in financial markets and wider adoption of investment products that generate capital gains. A shift is also observed among taxpayers using professional help for filing returns. The share of applicants assisted by experts reporting capital gains rose from 51% in AY 2024-25 to 68% in AY 2026-27. Among self-declarants, this figure increased from 23% to 38%.

Almost two-thirds of first-time filers who opt for expert assistance reported capital gains in AY 2026-27. Their share increased from 44% in AY 2024-25 to 64%. This suggests that more new taxpayers are starting their financial journey with investment income, not just salary.

Between AY 2024-25 and AY 2026-27, the share of self-declarants reporting capital gains grew from 23% to 38%, while those guided by experts increased from 51% to 68%.

Young Investors Lead the Shift Towards Market-Linked Income

The shift towards investing and trading is particularly noticeable among younger taxpayers. Among self-declarants under 25, 75% filed complex returns in AY 2026-27, compared to 60% in the previous fiscal year. This increase of 15.5 percentage points is the highest across all age groups.

In this group, the share of ITR-3 filings rose from 28% to 44%, while ITR-1 filings decreased from 41% to 25%. ITR-3 is typically used by individuals reporting income from business or profession, including relevant trading income.

Young investors also report losses more frequently. Among self-declarants under 25 who reported capital gains or losses, 37% reported a loss in AY 2026-27, the highest proportion among age groups. This proportion gradually decreases with age, reaching 21% among taxpayers over 60.

Middle-income taxpayers are also forming investment portfolios. Nearly half of taxpayers in the gross income range of 5 to 10 lakh rupees filed complex returns in AY 2026-27. Their share increased to 49.6% from 36.2% in AY 2025-26, representing the sharpest growth among all income groups.

The report suggests that middle-income taxpayers are increasingly combining employment income with stocks, trading, and independent professional activities. At the top of the income distribution, the share of self-declarants reporting gross income above 50 lakh rupees rose to 8% in AY 2026-27 from 4.5% in AY 2023-24, almost doubling in three years. The percentage of individuals reporting income above 20 lakh rupees also increased to 30.5% compared to 22.5% during the same period.

Women Increase Participation in Investing and Trading

Female taxpayers are also showing more active participation in investment-related activities. The share of female applicants reporting capital gains rose to 30.5% in AY 2026-27 from 26.1% in AY 2025-26. Women filing ITR-2 for capital gains increased their share to 26.8% from 23.3%, and ITR-3 filings rose to 16.1% from 13.2%.

The report also highlights the growing representation of women in higher income brackets. The share of female self-declarants reporting income above 50 lakh rupees increased from 3.7% in AY 2025-26 to 5.1% in AY 2026-27, representing a relative increase of 38%. For men, the corresponding share increased from 9.6% to 12.2%, or 27%.

Although the share of women earning over 20 lakh rupees remains lower than that of men, the growth rate in higher income brackets among women is higher.

Investment Activity Continues Beyond Retirement

The report also refutes the assumption that investment activity declines after retirement. While 44% of taxpayers aged 40-50 reported gross income above 20 lakh rupees in AY 2026-27, compared to 9% among those over 60, older taxpayers were more inclined to report capital gains. Approximately 40% of taxpayers over 60 reported capital gains, compared to 35% among those aged 40-50.

More than half of taxpayers over 60 also filed complex returns, indicating that investment portfolios and income-generating assets remain active even after a reduction in regular employment income.

Key Findings From The Report Include:

According to ClearTax, 62% of all declarations in AY 2026-27 were non-ITR-1 declarations, compared to 53% in AY 2025-26 and 40% in AY 2024-25.

47% of self-declarants reported income from investments, business, freelancing, or cryptocurrency, significantly higher than 9.5% in AY 2022-23.

75% of self-declarants under 25 filed complex returns, compared to 60% in the previous fiscal year, indicating earlier participation in investments and independent income-generating activities.

49.6% of self-declarants in the income bracket of 5 to 10 lakh rupees filed complex returns, highlighting the expansion of diversified income sources and investment activity beyond high-income households.

30.5% of female applicants reported capital gains, compared to 26.1% in AY 2025-26, reflecting growing participation in investment markets.

Icrier study shows growth in female employment in India, but under less favorable conditions
Read more
business-standard.com

Icrier study shows growth in female employment in India, but under less favorable conditions

According to a study conducted by the Indian Council for Research on International Economic Relations (Icrier), the number of women in the labor force in India has almost doubled between 2017–18 and 2025. However, this growth is concentrated in unprotected employment sectors, accompanied by a reduction in working hours and an expansion of the wage gap.

The study, titled 'Participation Paradox: Women's Work and Time Use in India from 2017–18 to 2025,' found that women have taken up more paid work, while their unpaid domestic responsibilities have not decreased. This has resulted in them having less time for rest and self-care.

The authors, including Tanu M Goyal, Shravani Prakash, Ketaki Gaikwad, and Arjuna Tandon, based on data from the Periodic Labour Force Survey (PLFS), reported that the number of working women increased from 104 million in 2017–18 to 201 million in 2025. Meanwhile, the ratio of female workers rose from 22 percent to 38 percent. It should be noted that the figures for 2025 are based on a revised PLFS with an increased sample size and calendar period, and the authors caution about the need for caution when comparing with 2017–18 data.

The increase in employment was concentrated in rural India and the agricultural sector. The female worker ratio in rural areas increased from 23.7 percent to 44.9 percent, while in urban areas it grew from 18.2 percent to 25.9 percent. The share of men in the primary sector of rural areas decreased from 54.1 percent to 47.2 percent, while the share of women in rural areas increased from 70.7 percent to 73.3 percent. The study noted: 'Structural transformation is visible for men, but it has largely bypassed women in the country.'

Regular wage employment could not keep pace with the growth rate. Among rural women, self-employed workers increased from 13.9 million to 56 million, raising their share in rural female employment from 18.6 percent to 37.2 percent. Meanwhile, regular wage employment increased from 7.9 million to 13.9 million, but its share decreased from 10.5 percent to 9.3 percent. The authors concluded that 'the additional women entering the workforce primarily came through self-employment and unpaid family labor, which are the most unstable and least paid categories.'

The authors suggest that such a sharp rise in rural India is harder to interpret as a reaction to improved opportunities; rather, it indicates that rural women are 'drawn in out of necessity, whether in agricultural activities or home-related enterprises.' The report also mentions an alternative view presented by the Economic Survey for 2023–24 and some researchers, according to which the growth was driven by opportunities.

Average weekly hours decreased for all groups between 2017–18 and 2025, but the working week for rural women decreased the most—by more than six hours. The study notes: 'The increase in participation along with the reduction in hours per worker implies an expansion of the workforce towards increasingly marginal, low-intensity activities.'

The wage gap also widened. The nominal monthly wage of rural men increased by approximately 65 percent over the specified period, while for rural women, this growth was 41 percent. In 2025, rural women earned about 45 percent of the monthly salary of rural men, compared to 53 percent previously. In nominal terms, the monthly gap in rural areas almost doubled, increasing from approximately 4200 rupees to over 8000 rupees.

Unpaid labor of women remained virtually unchanged. Time use surveys for 2019 and 2024 show that the difference in unpaid domestic labor remained generally constant—about 223 minutes per day among participants in 2024, and the difference in caregiving increased from 58 to 63 minutes. In 2024, working women also had less time for self-care than women overall: 18 minutes less in rural areas and 31 minutes less in urban areas, while working men had slightly more time than men overall.

Six out of ten women not in the labor force cited childcare and household obligations as the main reason, whereas men had almost no such reasons. The authors call for a shift from maximizing participation to ensuring structural transformation. They recommend implementing more childcare services, enforcing kindergarten rules, introducing paid paternity leave and shared parental leave, setting employment targets for women in production-related incentive schemes, as well as social protection for women working in the gig economy, and conducting regular time use surveys alongside PLFS.

ICRIER study shows that despite increased female employment in India, the burden of household chores remains predominantly on them
Read more
www.aajtak.in

ICRIER study shows that despite increased female employment in India, the burden of household chores remains predominantly on them

In India, there is an increase in the number of women entering the labor market, yet the volume of unpaid domestic work remains virtually unchanged. According to the ICRIER report titled 'Participation Paradox,' the share of women in the workforce has significantly grown over the past eight years, but the distribution of household chores has not changed.

The number of working women in India has increased from 104 million in 2017–2018 to 201 million by 2025. Consequently, their share in the labor force has risen from 22% to 38%.

This growth is particularly noticeable in rural areas. In rural areas, the share of women in the labor force increased from 23.7% in 2017–2018 to 44.9% in 2025. In urban areas, this figure rose from 18.2% to 25.9%. Nevertheless, despite more active participation in paid work, an equal division of household chores has not occurred.

The largest increase in female labor force participation was recorded in rural areas: from 23.7% in 2017–2018 to 44.9% in 2025. In cities, this figure rose from 18.2% to 25.9%.

Despite the increase in women's participation in paid work, men's contribution to housework remains low. According to statistics, women spend an average of 464 minutes daily on household chores, while men spend 178 minutes. This means that women perform 4 hours and 46 minutes more domestic work daily than men.

The burden of domestic care also affects women's free time. The gap between men and women regarding time allocated for rest and entertainment has widened: in 2019, this gap was 57 minutes, and by 2024, it reached 70 minutes.

Responsibility for the home and children continues to create difficulties for women when seeking employment. About 60% of surveyed women reported that they cannot work outside the home due to household duties and childcare, whereas only 1% of men cited domestic responsibilities as a reason for being unable to work.

Alongside labor force participation, a gender pay gap persists. In rural areas, women's wages are about 45% of men's, and in urban areas, this figure reaches 61%. Thus, even with an increase in the number of working women, their income does not match that of men.

These data indicate that despite entering the labor market, the division of household chores between women and men is not equal. Many women are forced to perform tasks such as cooking, cleaning, and childcare in parallel with office work, which negatively affects their personal time and rest.

Popular