The DXY spread is an indicator that traders should not check once and forget, as it can change during a trading session depending on liquidity fluctuations, volatility, and market activity.
Although Exness publishes average DXY spreads on its website, the most relevant information for a trader preparing an order is the live spread displayed directly in the trading platform. This difference is especially important when US economic data is released, as DXY prices can change sharply, and transaction costs can transform in mere seconds.
What the DXY spread shows
Each DXY quote includes two price values. The spread is defined as the difference between these two prices. For example, if the ask price is 98.928 and the bid price is 98.916, the net price difference will be 0.012.
This difference immediately generates costs upon opening a position. The exact monetary amount depends on the position size, contract specifications, and account currency. This amount cannot be estimated solely by the price difference without checking the corresponding pip value and contract size.
Checking the live spread in Exness Terminal
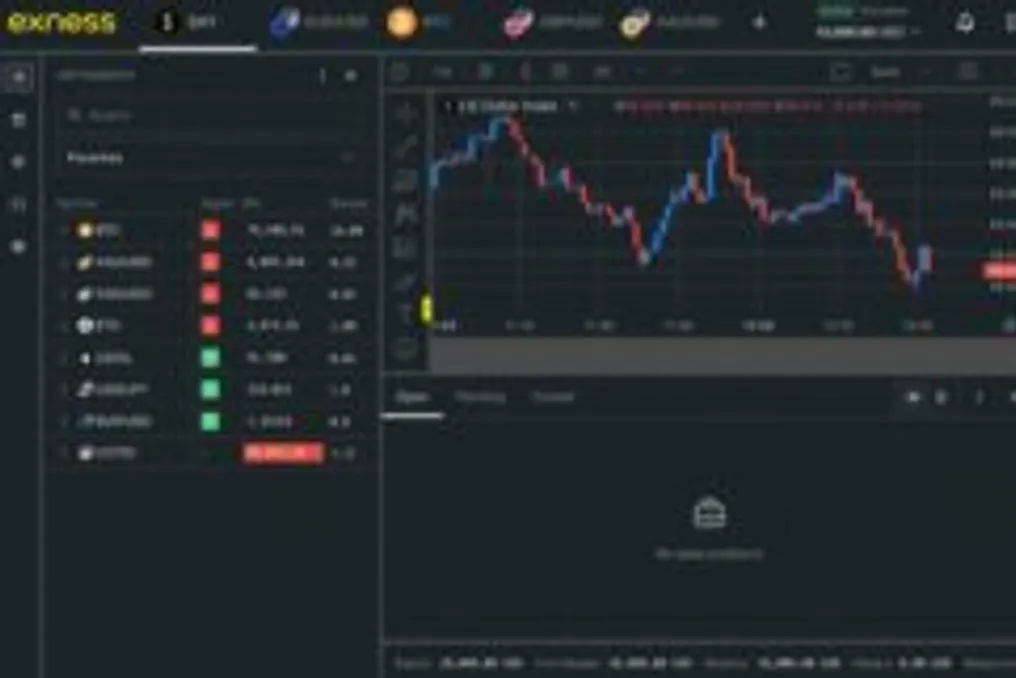
In Exness Terminal, you can see the current DXY spread directly in the toolbar. The displayed value represents the instantaneous quote and will change according to market conditions.
To find this indicator, you need to monitor the column update as the buy and sell prices change. Traders can keep DXY in the toolbar while observing the chart and preparing an order in the right part of the terminal. Exness provides similar instructions in its official guide on checking spreads.
Live spread vs. average spread—different indicators
The spread shown in Exness Terminal reflects current trading conditions. The average spread published on the DXY page is based on historical price data. These two indicators serve different purposes.
Historical spread data can provide useful context for the current figure. For instance, an Exness Pro account recorded an average DXY spread 83% lower than the industry average between March 29 and April 4, 2026. This comparison covered the narrowest accounts available only for spread, from ten brokers. Since this result pertains to a specific period and sample, traders should still check the live spread before placing every order.
The live spread can be higher or lower than the published average at any time. This does not necessarily indicate a pricing error; it reflects changing market conditions.
Furthermore, the Exness website has a trading calculator that estimates the cost of the spread, margin, commission, swaps, and pip value. Its spread estimation uses the average value of the previous trading day, so it cannot be considered a guaranteed execution cost.
Converting the spread into trading cost
The smallest displayed spread does not always mean the cheapest trade, as the position size determines how much the spread will affect the account. A simplified calculation is as follows: Estimated spread cost = spread × pip value × position size.
However, there are differences in instrument conventions, and DXY cannot be treated as if it uses the same contract specifications as EURUSD. A safer approach is to enter the account type, currency, DXY symbol, and assumed lot volume into the trading calculator. Then, you must cross-reference the order with the current buy and sell prices in the Exness Terminal. The calculator is for planning, whereas the terminal demonstrates conditions closer to the moment of execution.
Reasons for changes in the live DXY spread
DXY pricing is subject to the available liquidity at the time of order placement. The spread can change for several reasons:
Nonfarm Payrolls data and the US Consumer Price Index (US CPI) are particularly important, as both can alter expectations regarding Federal Reserve policy. When reported figures significantly deviate from market expectations, DXY can quickly overreact.
A wider spread during such periods increases the distance the market must travel before a new open position reaches the break-even point. This can also make short-term strategies more sensitive to execution costs.
Practical checks before trading
Before opening a DXY position, traders can check four indicators. It is also necessary to confirm the account type, as spread-only accounts and commission accounts may present costs differently. Therefore, comparing only the visible spread may give an incomplete picture if a separate commission is applied.
The stop-loss distance and available margin are also important. A low spread reduces one component of the trade cost, but it will not protect the position from adverse DXY movement.
The current value remains the most useful. Average spreads help traders compare accounts and understand typical pricing, while the live spread shows what is happening right now.
Exness Terminal integrates the DXY quote, chart, spread, and order form into one browser-based workspace. This allows users not to rely solely on the historical average but to check current prices immediately before preparing a position.
Nevertheless, the final trade cost may still differ from the estimate when market conditions change. Therefore, monitoring the live spread should become part of the order placement process, especially during periods of major US data releases.