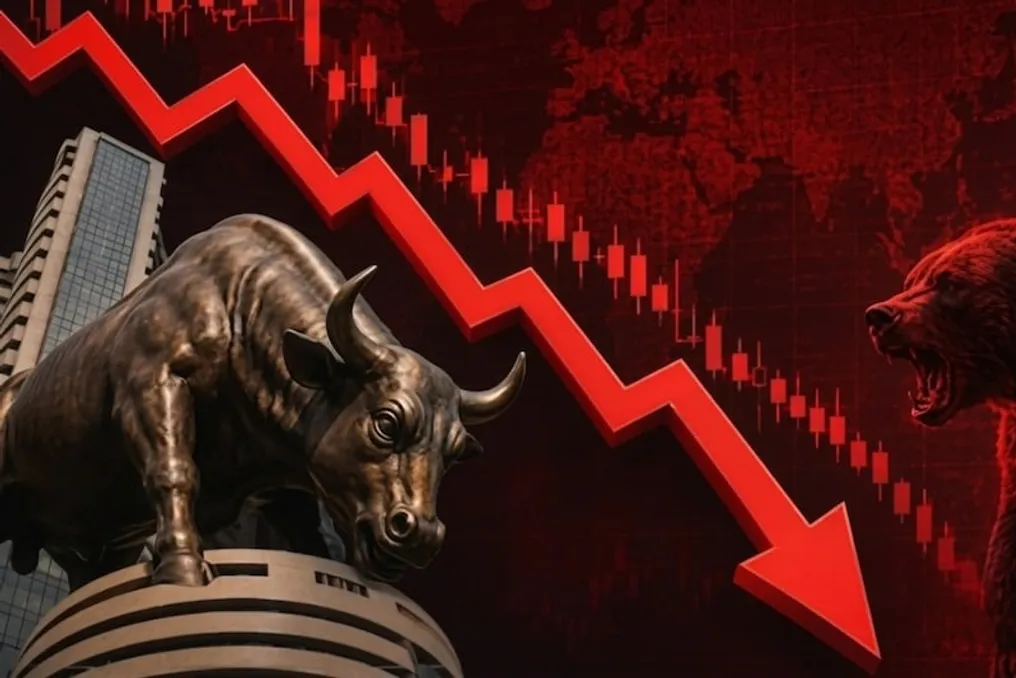
Signs of a downturn are being observed in the Indian stock market. The Nifty index closed for the second consecutive day lower, falling by 0.6% to 23,635 on September 9. This level is very close to the July low, which was 23,606. Market experts believe that if Nifty drops below the critical support level of 23,635 points and remains there, there is a possibility of a fall to 23,300. On the other hand, the level of 23,750–23,800 could become the first significant resistance for Nifty.
Pressure on the stock market is increasing amid rising oil prices. Many indicators analyzing market movement are also signaling weakness. A sustained sell-off was observed throughout the day on Nifty, indicating that sellers were more active than buyers. This suggests that weakness in the stock market may intensify in the coming days. Nifty represents the index of the 50 largest and most significant companies in India listed on the National Stock Exchange, and its movement depends on the fluctuations in the share prices of these companies.
Currently, the 23,635 level is considered the most important support level for Nifty, as it is close to the July low of 23,606. If Nifty falls below this level and consolidates there, it could lead to further selling. In this scenario, the next support level for the index might be around 23,300. Conversely, if Nifty starts to rise, 23,750–23,800 could become the first major resistance. If this range is overcome, the next serious challenge for Nifty will be the 24,000 level. According to daily data, important support levels for Nifty may be 23,620, 23,588, and 23,537, while sales are expected to halt at levels 23,724, 23,756, and 23,808.
Nifty is currently trading below several important indicators that show a downward trend. This may indicate extremely weak stock market momentum at present. The Nifty RSI (Relative Strength Index) has dropped to 30.88, which is close to the 30 mark. Typically, reaching a level around 30 indicates that a significant amount of selling has occurred in the shares or index, although this does not guarantee immediate market growth.
Another important indicator, MACD (Moving Average Convergence Divergence), has also weakened, and red histograms are increasing on the index chart. This is also regarded as a sign of weakness. Furthermore, Nifty closed below the Lower Bollinger Band. Given these signals, continued pressure can be predicted over the next few trading sessions.
The banking index, Bank Nifty, is also under pressure. On September 9, Bank Nifty fell by 0.54%. Weakness was visible on the daily chart as the index closed below the Lower Bollinger Band. During trading, Bank Nifty dropped below the 200-Day Exponential Moving Average (200-Day EMA), but it slightly recovered above this level by the end of trading. Therefore, the 200-Day EMA will be closely watched in the coming days.
Currently, Bank Nifty is below the 10-, 20-, 50-, and 100-day Exponential Moving Averages (EMA). Its RSI has also fallen to 40.87. MACD remains below zero, and red histograms on the index chart have been increasing for the sixth consecutive working day. All these factors indicate persistent weakness in Bank Nifty.
Important support levels for Bank Nifty may be 56,724, 56,647, and 56,524. With increased selling, attempts by the index to stabilize at these levels can be observed. On the other hand, important resistance levels are at 56,971, 57,047, and 57,171. According to Fibonacci Retracement, stops are possible at 57,049 and 57,367, while support may be found at 56,493 and 56,024.
Market volatility, measured by the India VIX, closed unchanged at 11.16. This figure is below its short-term moving average, which may suggest that there is no excessive panic in the market currently, and the probability of a sharp increase in volatility in the coming days is low. The Put-Call Ratio (PCR) of Nifty also rose to 0.83 on September 9 compared to 0.69 in the previous session. Generally, a PCR above 0.7 is considered a sign of some positive sentiment in the stock market, while a level below 0.7 may indicate weak sentiment. However, the future trajectory of the market cannot be determined based solely on the PCR.