According to the National Committee of the Republic of Uzbekistan on Statistics, the turnover of Uzbekistan's foreign trade from January to June 2026 reached 41 billion US dollars. This figure demonstrates an increase of $2.8 billion, which is 7.4% compared to the same period last year.
Import and Export Dynamics
The growth in trade volume was driven by an increase in imports against a decrease in export volumes. Imports grew by 21% year-on-year, reaching $25.1 billion, while exports decreased by 8.8%, amounting to $15.9 billion. Consequently, the foreign trade deficit increased to $9.3 billion, up from $3.4 billion the previous year.
Export Structure Excluding Gold
The main reason for the overall decline in exports was the sharp reduction in non-monetary gold supplies. The value of gold exports fell from $6.5 billion to $1.5 billion, and its share in the total export volume decreased from 37.3% to 9.5%. However, excluding gold, goods exports increased by 28.7% to $8.2 billion.
In the export structure, industrial goods accounted for 15.2%, other handmade products for 8.6%, food and live animals for 8.3%, and chemical products for 8.1%. Industrial goods exports grew to $2.4 billion, an increase of 22.8%, with textile yarn and fabric leading at $975.9 million and non-ferrous metals at $882 million. Exports of other handmade products almost doubled, reaching $1.36 billion, and clothing exports increased by 31.4% to $629.9 million. Chemical exports rose to $1.28 billion, mainly due to inorganic chemicals worth $789.1 million.
Exports of food and live animals increased by 9%, totaling $1.32 billion. The statistical agency noted an increase in fruit and vegetable supplies: 1,086,700 tons were exported over the six-month period for a total of $872.9 million, which is 3% more than the previous year. Supplies of onions, cabbage, carrots, and garlic increased in this category, while exports of sweet cherries and apricots decreased.
Textile exports grew by 24.1% to $1.6 billion, accounting for 10.1% of total merchandise exports. Finished textile goods made up 52.6% of textile exports, and yarn accounted for 31.1%. Services exports showed the strongest growth, increasing by 35.7% to $6.2 billion, representing 39.1% of the country's total export volume. Tourism and travel accounted for 52.9% of service exports, and transport services for 31.6%. Telecommunication and information services accounted for 8.8%, followed by other business services at 3%.
Increase in Imports Across Most Categories
Imports of goods and services increased by 21% to $25.1 billion. Goods imports grew by $4 billion to $22.2 billion, while services imports reached $3 billion, an increase of 12.3%.
Machinery and transport equipment became the dominant item of import, accounting for 32.8% or $8.25 billion, an increase of 25.1%. In this group, automotive supplies showed the largest growth, increasing by 31.7% to $2 billion, with passenger car imports rising by 84.5%. Supplies of power generation equipment grew by 56%, and telecommunications equipment imports almost doubled.
Industrial goods accounted for 14.8% of imports, or $3.73 billion, led by cast iron and steel worth $1.48 billion. Chemical imports accounted for 12.1% totaling $3 billion, with medical and pharmaceutical products making up the largest share at $966.4 million. Food and live animal imports increased by 44.2% to $2.82 billion, including a 67.3% rise in grain imports to $761.1 million.
Petrol imports sharply increased by 78.5% to $409.5 million, while diesel fuel imports decreased by 11.1%. In the services sector, tourism and travel led imports at 43.8%, followed by transport services at 27.5%.
Main Trading Partners
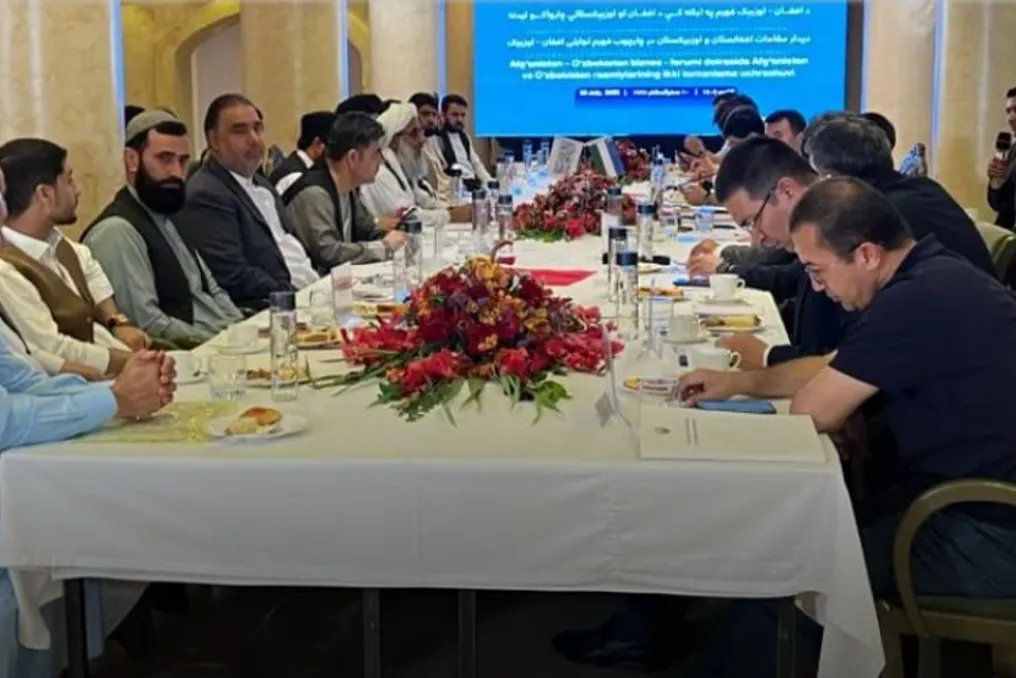
According to the report, Uzbekistan maintains trade relations with more than 195 countries. China remains the country's largest partner in terms of total trade volume with a share of 23.1%, followed by Russia with a share of 17.1%. Kazakhstan provided 6.8%, Turkey 3.4%, and Afghanistan 2.6%. Trade with Afghanistan grew by almost 50% over the year, reaching $1.08 billion.
Russia was the leading export destination, accounting for 14.9% of total exports, and China for 9%. Afghanistan accounted for 6.1%, while Kazakhstan and France each contributed 4.5%, Hong Kong 3.4%, and Turkey 3.3%. These five countries together accounted for more than half of Uzbekistan's exports. Exports to Hong Kong increased more than eightfold, from $72 million to $594.7 million.
The situation changed for imports: China took the first place with a share of 32%, and Russia 18.5%. Kazakhstan provided 8.2%, South Korea 3.6%, Turkey 3.5%, Germany 2.1%, and India 2%. These seven countries supply more than 70% of all goods and services imported into Uzbekistan.