The net profit of the joint-stock company (JSC Kvartz) for the first half of 2026 amounted to 5.9 billion soums. This figure significantly contrasts with the net loss of 46.7 billion soums recorded by the company for the same period in 2025.
The net profit of the joint-stock company (JSC Kvartz) for the first half of 2026 amounted to 5.9 billion soums. This figure significantly contrasts with the net loss of 46.7 billion soums recorded by the company for the same period in 2025.
The company's total revenue for the period from January to June increased by 55.9% compared to the previous year, reaching 307.6 billion soums. Profit for the last twelve months was 54 billion soums, demonstrating a growth of 145.7% relative to last year; however, the company notes that this figure reflects the results of past reporting periods and does not fully reflect the current financial improvement.
JSC Kvartz also achieved a significant reduction in its debt burden. Long-term loans and borrowings were fully repaid, decreasing from 107.3 billion soums to zero. Regarding short-term loans and borrowings, they decreased from 175.8 billion soums to 139.9 billion soums.
As of the end of the first half, Kvartz's total assets reached 506.1 billion soums, representing a decrease of 19.2% year-on-year. Meanwhile, equity capital increased by 28.3%, amounting to 244 billion soums. Retained earnings remained at minus 91.8 billion soums, indicating an improvement of 37% compared to the same period last year.
Some early claims that whales acquired about 270,000 BTC in thirty days received widespread coverage. These figures appeared repeatedly in different sources with varying dates, but their origin was often linked to an aggregator that is not cited for other reasons. These reports were simply large numbers confirming existing beliefs without specifying wallet names or methodology.
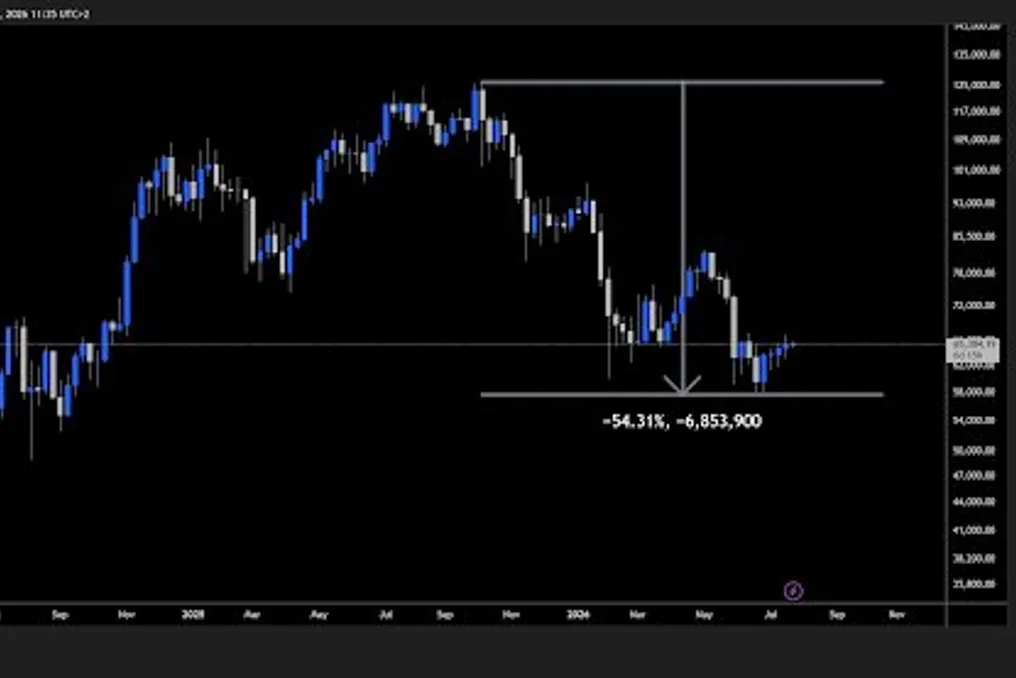
A similar approach to accumulation analysis applies to both markets under consideration. Bitcoin (BTC) has dropped by approximately 54% from its October 2025 peak, which exceeded $125,000. Gold (XAU) has lost about 29% from its daily record of $5,595.47 set on January 29th. Both assets are going through a difficult period, and in both cases, the reassuring factor is that patient investors continue to make purchases.
However, the main problem is how little of this activity can be seen.
The argument regarding gold's roadmap is hard to ignore. It suggests that since 2022, central banks have become dominant buyers of gold, acquiring it to meet reserve targets rather than for profit, making their demand largely independent of price. Initially, price-sensitive sellers sold in response to this demand, restraining price growth. When sales dried up, the price began to rise.
Applied to Bitcoin, spot exchange-traded funds (ETFs) and corporate treasuries act as central banks, placing the market in the middle of a process awaiting further acceleration. The mechanism remains sound, but more complex questions arise: does Bitcoin possess the necessary buyer, and is the gold buyer as stable as this model requires?
Long-term holders, defined as wallets holding coins for at least 155 days according to Glassnode's definition, have shifted from net selling volume to net buying volume. The net change in position over 30 days is positive, ranging from 50,000 to 100,000 BTC. This should be compared to similar periods in November 2024 and May 2025, when this figure was close to 400,000 BTC.
The analysis by wallet size becomes more interesting. Glassnode's accumulation trend indicator rates each holder group by balance and recent purchases on a scale from zero to one:
Buying activity weakens as wallet sizes increase. Addresses that can truly be called whales have mostly been inactive, and the media-attracting accumulation primarily comes from the smallest wallets in the network. This is another story, perhaps a better one depending on how much weight is given to retail investor conviction, but it is not the one being covered.
June was the worst month in history for US spot Bitcoin ETFs, with about $4.5 billion withdrawn. Citi lowered its twelve-month inflow forecast to zero. However, the situation changed: by the end of July, Glassnode reported a resumption of positive ETF flows, calling it the strongest positioning shift in a year, accompanied by short position closures and hedging unwinding.
Both indicators are true, but they occurred several weeks apart, which creates difficulties when trying to view ETFs as a central bank equivalent. Reserve managers do not behave this way. A source of demand that fluctuates from record outflows to the strongest inflow shift in a year within a month reacts to the price rather than absorbing it.
The gold side of the comparison has its own issues. In the first quarter of 2026, central banks sold 129 tons, with Turkey accounting for 60 tons in March alone. Net declared purchases across all reporting institutions totaled 16 tons.
According to the World Gold Council's estimate, the net purchase volume for the same quarter was 244 tons, higher than the 208 tons in the fourth quarter of 2025. The question arises: which figure is real? Both are technically correct. The announcement of purchases by the International Monetary Fund (IMF) is voluntary, and much remains undisclosed. The World Gold Council calculates a higher figure based on over-the-counter (OTC) activity in London and trade flows through Swiss refineries. This method is sound and likely closer to the truth than 16 tons, although it remains a reconstruction that circulates as if it were calculated.
Another flaw in the roadmap version concerns the actions of central banks before 2022. They consistently sold gold for nearly two decades. The volume of these sales was so large that fifteen European central banks signed the Washington Agreement in September 1999 solely to limit aggregate sales to 400 tons per year, as uncoordinated sell-offs led to price crashes to lows. Gold hit a bottom of about $250 per ounce during that period. Only in 2010 did central banks become reliable annual net buyers.
Thus, the institutions now credited with stabilizing gold prices are the same ones that held the ceiling for two decades. Nothing in the institutions themselves has changed; their reserve policy has changed. This part of the model, which is most important for those using gold ownership as a model for Bitcoin, is what is omitted.
Both markets demonstrate a lack of a buyer in completely opposite ways, which is easy to miss when comparing them. Gold trades confidentially, through dealers and vaults, so the transaction itself is hidden, and flows must be reconstructed later based on refinery throughput and OTC activity. Bitcoin, however, trades publicly, so every transaction is permanently visible, but it is still impossible to say with certainty who is behind it, as groups change with wallet redistribution by exchanges, address consolidation by custodians, or address relabeling. One market hides the deal; the other hides the trader.
A similar problem appears in price data. Gold prices are available about 23 hours a day, five days a week, whereas Bitcoin operates 24/7. Any comparison between them depends on how one accounts for the hours when one is closed. Bitcoin movements on weekends have no gold analogue for measurement. The situation is beginning to change: the appearance of 24/7 gold pricing on a growing number of platforms allows for adjustments to exposure while the traditional market is closed, instead of waiting for Sunday opening and accepting any level. This does not eliminate the Monday gap, as the underlying market still re-prices upon return, and weekend conditions are usually less active than weekdays. But the market, long defined by its operating schedule, is gradually turning into one that never fully closes, narrowing the structural difference between gold and Bitcoin that was previously taken for granted.
PrimeXBT is among the brokers offering 24/7 gold trading, allowing traders to move between Bitcoin and gold within a single platform while maintaining a crypto-oriented workflow through cryptocurrency-denominated accounts. For traders viewing these assets as complementary stores of value, the ability to trade them on a similar schedule eliminates one of the practical differences that historically separated them.
Accumulation data indicates that selling has stopped, but it does not suggest that a bottom has been reached. These two concepts are constantly mixed, and Glassnode itself cautiously frames this point: the transition from selling to buying tends to occur during periods of weakness when long-term investors accumulate and short-term participants reduce risks. This describes exhausted sellers, but says nothing about who will come next, when, or at what price.
None of this is a call to action. The absorption observed in June seems real, and both markets could well be forming a base. A narrower point is that accumulation narratives require more weight than the underlying data allows, in both cases.
When the next headline like this appears, it is worth asking three questions: what is the size of the holder? How is it measured? And relative to which opposing flows? The answer is usually less impressive than the headline.
Despite increased investor confidence following the recent Reserve Bank decision, ongoing tensions in the Middle East continue to create uncertainty for the South African bond market.
The South African bond market has regained some stability after the South African Reserve Bank decided to keep interest rates unchanged. However, the geopolitical situation in the Middle East and the US Federal Reserve's decision continue to negatively affect investor sentiment.
Investec Chief Economist Annabel Bishop noted significant volatility in South African bond yields in July. This volatility was triggered by the escalation of the conflict in the Middle East, prompting investors to withdraw funds from emerging market assets.
Bishop reported that the yield on ten-year benchmark bonds rose from 8.32% at the beginning of the second week of July to 8.93% due to the worsening crisis in the Middle East mid-month. Nevertheless, market conditions improved after the Monetary Policy Committee's (MPC) decision last week.
Keeping the MPC rate stable helped bring the yield down to 8.66% at the end of last week, with a trend towards 8.50%, although there has been noticeable instability this year, with yields dropping below 8.00% before the Middle East war.
In Bishop's view, the Reserve Bank's measured approach strengthened investor confidence. She emphasized that 'the restrained tone of the MPC statement in July improved investor sentiment,' and also mentioned that the manager noted at the beginning of the month that 'the past two years have led to a significant re-rating of South Africa.'
Furthermore, the improvement in South Africa's fiscal position boosted investor confidence. Credit rating upgrades were received, and the country exited the FATF grey list. Financially, South Africa has transformed from a 'problem child' into a rare example of a country where sovereign debt stabilization is expected this year.
Bishop forecasts that inflation will remain relatively controlled despite recent volatility in global energy markets. Since there are unlikely to be significant changes in fuel prices in August, slight inflationary pressure is expected in the short term.
Although consumer inflation reached 5.0% year-on-year in June, further acceleration in July is unlikely due to lower fuel and electricity costs. Bishop suggested that CPI inflation could fall below 5.0% year-on-year in July, considering the rise in gasoline prices a year ago compared to the drop this month.
However, international events continue to pose risks to the local market. Following the resumption of the conflict in the Middle East, foreign investors reduced their stake in South African government bonds. Foreigners sold bonds worth R19.8 billion as of the 17th of the month, contrasting with net foreign purchases of R54.3 billion on the same date last year.
Bishop also cited warnings from international institutions regarding the potential economic consequences of prolonged geopolitical instability. The World Bank warned that the Middle East conflict could slow global growth to its lowest level since the Covid-19 pandemic due to rising energy prices, increased inflation, and higher borrowing costs.
The International Monetary Fund also cautioned that 'high public debt in several major economies puts sovereign markets at risk of fiscal sustainability reassessment, especially if other adverse shocks occur simultaneously.'
Meanwhile, Bianca Botess, Managing Director of Citadel Global, noted that markets moved again due to events in the Middle East after reports that Iran had launched new strikes against the United States overnight. Botess stated that it resembled a déjà vu, as Iran attacked the United States at night, jeopardizing a new ceasefire agreement.
She pointed out the mixed dynamics in the US markets: the S&P 500 index closed slightly higher, the Nasdaq fell almost 1%, and the Dow Jones Industrial Average reached new record highs. Asian markets also felt pressure, particularly the technology-focused KOSPI index, while oil prices rose nearly 4%, reaching around $85 per barrel, in response to heightened geopolitical uncertainty.
Botess added that 'this is the day X for the Federal Reserve's interest rate announcement, which will be closely watched.' Despite the increased uncertainty, the rand remained relatively stable, trading at R16.74 against the US dollar, R19.08 against the euro, and R22.26 against the British pound on Wednesday.