The sodium battery, which promises to make electric vehicles more accessible and more resistant to low temperatures, still presents a significant limitation compared to lithium in terms of autonomy per kilogram.
The sodium battery, which promises to make electric vehicles more accessible and more resistant to low temperatures, still presents a significant limitation compared to lithium in terms of autonomy per kilogram.
The first global series electric car equipped with a sodium-ion battery is the Changan Nevo A06. This sedan will be marketed in China using the Naxtra battery, manufactured by CATL, the world leader in the battery sector. The unit has 45 kWh and offers approximately 400 km of range under the Chinese CLTC cycle, a value comparable to entry-level electric models.
The main advantage of this technology manifests itself in adverse climatic conditions. Tests conducted in Inner Mongolia demonstrated that the sodium battery managed to maintain over 90% of its capacity at a temperature of -40°C, in addition to charging at -30°C and operating down to -50°C. In contrast, traditional batteries can suffer a charge drop of up to 50% in similar scenarios.
Sodium has notable benefits, such as being about a thousand times more abundant than lithium and being able to be extracted in various parts of the globe, which reduces dependence on restricted suppliers. Since sodium cells do not require lithium, cobalt, or nickel, they are inherently safer, presenting a lower risk of fire, and demonstrate superiority in cold temperatures.
However, the main weakness lies in energy density. Sodium batteries store less energy per unit of weight (between 100 and 175 Wh/kg) when compared to lithium (which ranges between 150 and 350 Wh/kg). This implies that, in practice, electric vehicles equipped with sodium will have a shorter range or will require larger and heavier packs. For this reason, the initial application of this technology should focus on urban and short-distance cars.
Regarding cost, sodium can represent a positive differential, given that it uses abundant and cheap raw materials. Although, at the moment, the cost is still close to that of the most economical lithium batteries, CATL forecasts reaching this parity as early as 2026. However, industry analysts present divergent views on the speed of this process, estimating that, in the medium term, prices could be between US$ 40 and US$ 50 per kWh as production scales up.
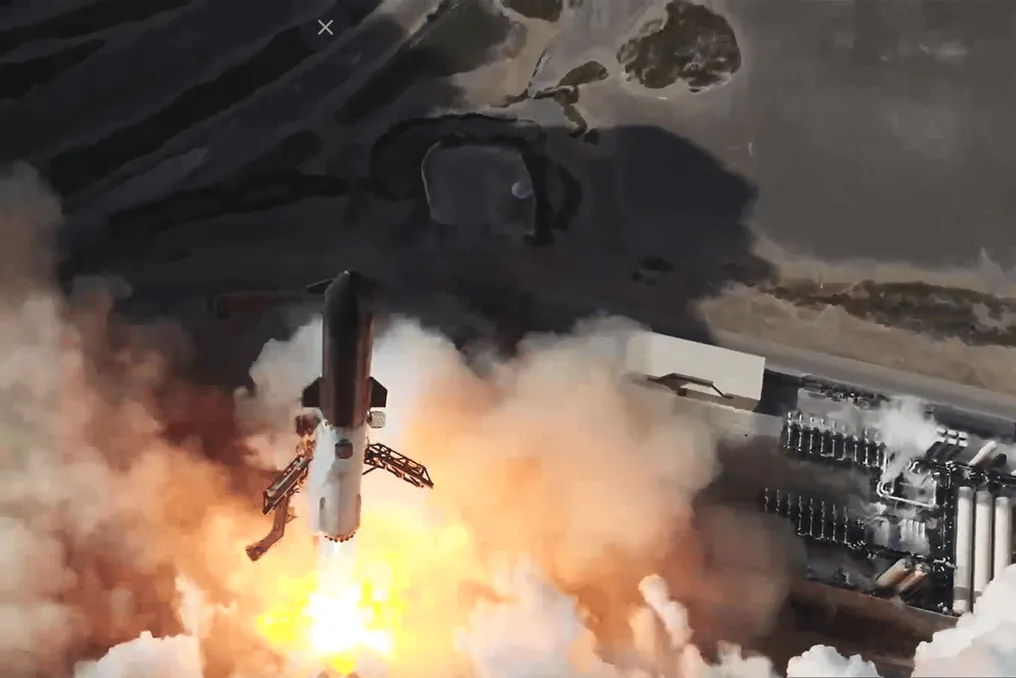
SpaceX conducted the thirteenth launch of the giant Starship rocket this Thursday, the 17th. The company, led by Elon Musk, had a ninety-minute window to start the takeoff, and the flight was expected to last a little over an hour.
The main objective of this mission was to monitor the system's operation in various phases, such as module separation, engine ignition, and vehicle return. A major concern was the performance of the Super Heavy booster. In a previous flight, which took place in May of this year, this stage failed to return properly for a controlled landing, resulting in its fall into the ocean.
According to SpaceX itself, adjustments were implemented to both hardware and software to address the problems detected in that past mission. However, upon reaching space, it was observed that not all engines appeared to have been activated, and Super Heavy again faced difficulties.
In addition to testing the rocket, this operation served as a demonstration for new components of the Starlink network. During the test, twenty Starlink V3 satellites were released. These satellites will follow a suborbital trajectory and will be destroyed upon re-entering the atmosphere.
The company reported that the Starlink V3 models are larger and have the potential to substantially increase the capacity of the satellite internet network. The satellites also attempted to establish communication with the Starlink constellation using high-capacity lasers before their atmospheric re-entry. Six of these units were equipped with cameras intended to record images of Starship and its heat shield throughout the flight.
Analyzing the history, Flight 1, in April 2023, ended with Starship exploding still attached to Super Heavy due to engine failures that activated the vehicle's self-destruct system. Flight 2, in November 2023, allowed the initial separation of the ship from Super Heavy, but the booster subsequently exploded, leading to the loss of Starship before the completion of the flight.
Flight 3, in March 2024, lasted approximately fifty minutes and represented a significant advance, despite the ship being lost before the scheduled landing. In June 2024, Starship managed to achieve a controlled landing in the Indian Ocean, while Super Heavy landed in the Gulf of Mexico.
In October 2024, SpaceX succeeded in catching Super Heavy on the launch tower for the first time, and Starship also executed a controlled re-entry. Flight 6, in November 2024, recorded a controlled landing of the booster and the reactivation of an engine in space.
Subsequent events include Flight 7, in January 2025, where Starship was lost after an explosion during the test. Flight 8, in March 2025, saw the upper stage lose stability about eight minutes after launch and be destroyed. Flight 9, in May 2025, marked the first reuse of a Super Heavy, although failures prevented some planned experiments.
The mission of Flight 10, in August 2025, achieved crucial goals, such as tests with satellite simulators, engine reignition in space, and controlled re-entry. Flight 11, in October 2025, successfully concluded the Starship V2 phase, encompassing the controlled landing of Super Heavy, the ship's re-entry, and new operational tests.
Finally, Flight 12, in May 2026, was the first test of the Starship V3 version, showing notable progress, such as the launch of satellite simulators and two modified Starlink satellites. However, the Super Heavy booster experienced a failure during the return attempt because the engines did not reignite correctly after separation.
For those who do not yet have a smart speaker at home or wish to buy a gift, this is a good time to look at the options from the Echo Dot line sold on Amazon. Three versions of the most updated model have been presented, each in a distinct shade, all equipped with Alexa and priority access to Alexa+.
The black Echo Dot offers powerful and vibrant sound within a compact design, suitable for various environments. It has both Wi-Fi and Bluetooth connectivity, facilitating its integration into the user's routine. The Alexa assistant can be activated by voice commands to play music, manage smart devices, create lists, and perform other functions. This model also guarantees early access to Alexa+, which represents an enhanced version of the assistant with more advanced features.
The white variant of the Echo Dot is ideal for those seeking a more neutral and clean aesthetic. Its performance is identical to the black model: it features clear and robust audio, support for Wi-Fi and Bluetooth, and Alexa is always available to assist. Like the black model, the white version includes early access to Alexa+, allowing users to experience the assistant's innovations before others.
For those who prefer to add a splash of color to their decor, the blue Echo Dot emerges as a stylish alternative. In addition to its distinctive appearance, it meets all the expectations of the model: superior sound quality for a compact speaker, Wi-Fi and Bluetooth connectivity, voice control through Alexa, and early access to Alexa+ at no additional cost.
All three models are currently available on Amazon; however, stock levels may change at any time. It is recommended to check the link before availability changes if any of the models attract the consumer's interest. It is important to note that this article contains links generated by an affiliate program, and the value for the reader remains unchanged, although Olhar Digital may receive a commission.
Scientists use technology capable of detecting subtle changes in the planet's magnetic field to determine what lies kilometers beneath the Earth's surface without conducting any excavations.
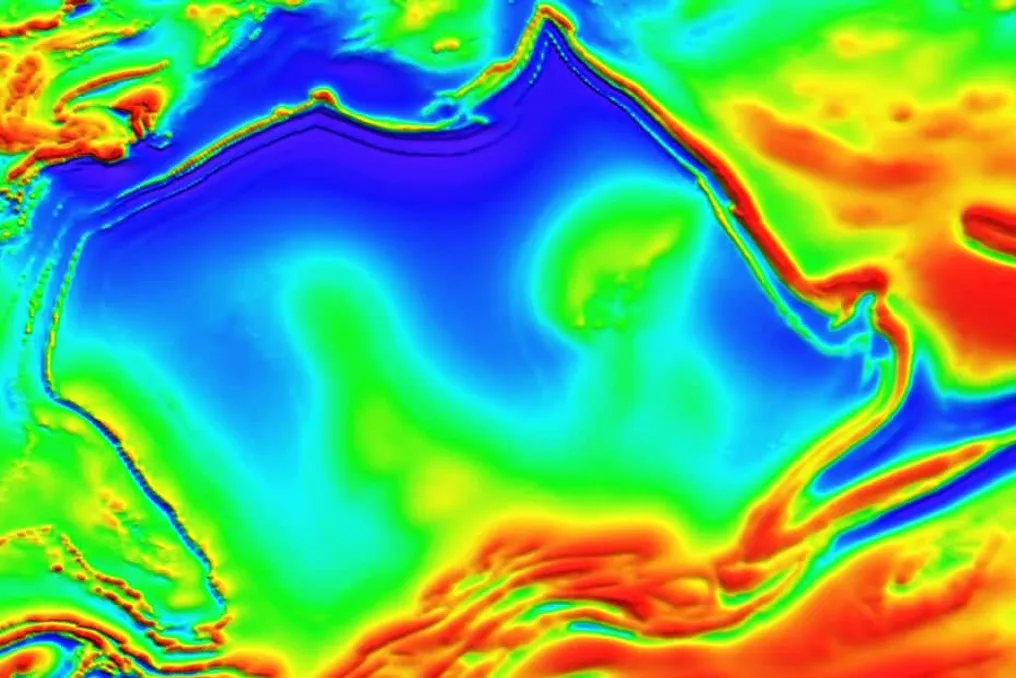
Based on these minor fluctuations, researchers can identify geological faults, ancient magma rivers, mineral deposits, and hidden structures in the depths. A recent study in Australia demonstrated this technique by creating a more detailed image of the Australian Magnetic Anomaly—a vast underground structure beneath the Northern Territory whose shape resembles the outline of the Australian continent.
It is important to note that this work did not require new field measurements or flights; instead, a processing algorithm was applied to eliminate noise and distortions from previous surveys, allowing geological features to be revealed with greater clarity. Thus, researchers were able to gain new information from existing data.
This Australian example illustrates a tool that geophysicists worldwide, including those in Brazil, have used for decades. To understand this technology, specialists discussed how rocks leave 'signatures' in the Earth's magnetic field and how this information helps reconstruct the planet's history.
Even if two rocks look almost identical, they can tell completely different stories to a geophysicist. This occurs because each rock type possesses its own physical properties. Some rocks have almost no effect on the surrounding magnetic field, while others containing minerals such as magnetite, titanomagnetite, hematite, or pyrotite cause small local disturbances. These disturbances can be registered by highly sensitive magnetometers, even if the minerals are present in low concentrations, generating differences on the order of a few nanoteslas—magnitudes millions of times smaller than the field created by a standard refrigerator magnet.
Gelvam André Hartmann from Unicamp emphasized that rocks do not alter the global magnetic field of the Earth but produce local disturbances that can be measured by extremely sensitive magnetometers. According to professors from Unipampa, the term 'anomaly' in geophysics describes precisely the difference between the expected magnetic field for a given area and what is actually measured by instruments in the field.
These small deviations reveal not only information about what rocks are under the ground but also contain data about the region's geological past. In addition to the magnetization caused by the current Earth's magnetic field, rocks usually retain residual magnetization that was recorded during their formation or acquired as a result of subsequent geological events. Thus, the rocks themselves preserve a record of the magnetic conditions that existed during their formation, while aeromagnetic measurements record these signals. The signal intensity depends on factors such as the amount of magnetic minerals, depth, size, geometry, and orientation of the rock bodies.
It is important to make a distinction: the anomalies studied in geological surveys are not related to the South Atlantic Magnetic Anomaly (SAMA). While crustal anomalies are formed by rocks of the Earth's crust, SAMA is a global phenomenon arising in the Earth's outer core at depths of thousands of kilometers. Its effects are linked to reduced protection from energetic particles in space over the South Atlantic, which affects satellites and spacecraft.
Since rocks cause such subtle disturbances in the magnetic field, scientists use aeromagnetic surveys. During these surveys, aircraft equipped with sensors follow parallel trajectories over the area being investigated. To avoid the influence of the metal fuselage of the aircraft itself on the measurements, sensors are installed on an extended structure at the tail of the aircraft.
During flight, the equipment takes dozens or hundreds of measurements per second. Because the planes operate at low altitudes—usually around 100 meters above the ground—and follow regularly spaced lines, a detailed portrait of the magnetic signal can be constructed along the entire route. After landing, the data consists of a raw sequence of measurements. Before interpreting them, they undergo processing stages to remove equipment noise, navigation variations, and natural fluctuations of the planet itself. Then, researchers exclude the contribution of the main geomagnetic field (generated in the core) to isolate only the signal produced by the crustal rocks.
The result of this refinement is maps of magnetic anomalies showing the spatial distribution of changes in the subsurface. Researchers note that interpreting these maps allows for the identification of patterns associated with important geological features, such as faults, shear zones, dikes, magmatic intrusions, contacts between different lithological units, and potentially mineralized bodies. Geophysical inversion methods are also currently employed: computer models divide the subsurface into smaller elements and estimate what distributions of magnetic properties could have caused the measured surface signals, helping to build two-dimensional and three-dimensional models of the subsurface.
Collecting data in the air is only half the job. When the plane lands, the magnetometer readings form a raw dataset that mixes the reaction of the rocks with interference from the aircraft itself and natural fluctuations of the Earth's magnetic field. Careful filtering is required to isolate the rock signal. Professors from Unipampa explain that one of the first steps is magnetic compensation, a mathematical calculation that eliminates interference created by the metallic frame and electrical systems of the aircraft in motion.
Next, algorithms apply frequency filters to 'separate' the information. This separation allows distinguishing signals originating from shallow structures (such as potential mineral deposits) from those occurring in rocks kilometers deep within the crust. It is this computational refinement that transforms millions of measurements into detailed geological maps. Analyzing the Australian study, Gelvam André Hartmann recalled that 'the anomaly itself was already known.' He continued: 'The main breakthrough of the work lies in applying modern processing and interpretation methods, which allowed extracting much more geological information from the existing dataset.'
Despite frequent comparisons to an 'X-ray,' these maps are not a direct photograph of the planet's internal structure. Gelvam André Hartmann notes that 'the analogy helps explain the idea to the general public, but it has limitations.' He believes the best analogy is that aeromagnetic surveying works like a medical examination: it reveals patterns invisible to the naked eye, indicates where further detailed study should be conducted, and significantly reduces uncertainty, but rarely answers all questions about the subsurface on its own.
This limitation stems from the fact that the same magnetic response registered on the surface can be caused by various geological configurations in the depth—for example, different combinations of shape, size, depth, or amount of magnetic minerals. Therefore, magnetic data is rarely interpreted in isolation. Other methods used include gravimetry, which measures changes in rock density; electrical and electromagnetic methods, which analyze specific resistance and conductivity; and seismic methods, which investigate the elastic properties of materials. Furthermore, magnetometry is integrated with gamma spectrometry, a technique that measures naturally emitted gamma radiation from elements such as potassium, uranium, and thorium, to distinguish geological units with similar magnetic responses.
In addition to helping to understand Earth's history, magnetometry is a vital tool in mineral exploration and planning new exploration campaigns. Many mineral deposits are associated with geological structures that cause contrasts in rock magnetic properties. Faults, shear zones, and fracture systems, for instance, can indicate favorable conditions for the concentration of gold, copper, nickel, iron ore, and other economically important resources.
In recent years, drones have also been included in these studies. Equipped with magnetometers, unmanned aerial vehicles (UAVs) can fly closer to the ground and obtain high-resolution data in specific areas. They are usually used after regional aeromagnetic surveys to detail the subsurface and guide subsequent stages of geological exploration, such as drilling.
The application of this technique has also played an important role in the history of science. In the 1950s and 1960s, the detection of bands of magnetic anomalies on the ocean floor provided evidence for seafloor spreading, which helped solidify the Theory of Plate Tectonics.
Despite the recent focus on the Australian case, aeromagnetic surveys have been part of routine Brazilian geophysics for decades. Virtually the entire territory of the country exhibits magnetic anomalies related to crustal rocks. The first aerial surveys in Brazil date back to the early 1950s in São João del Rei (Minas Gerais). This project, commissioned by the National Nuclear Energy Commission (CNEN), used magnetic and radiometric sensors aboard aircraft to aid in the exploration of radioactive minerals, such as uranium.