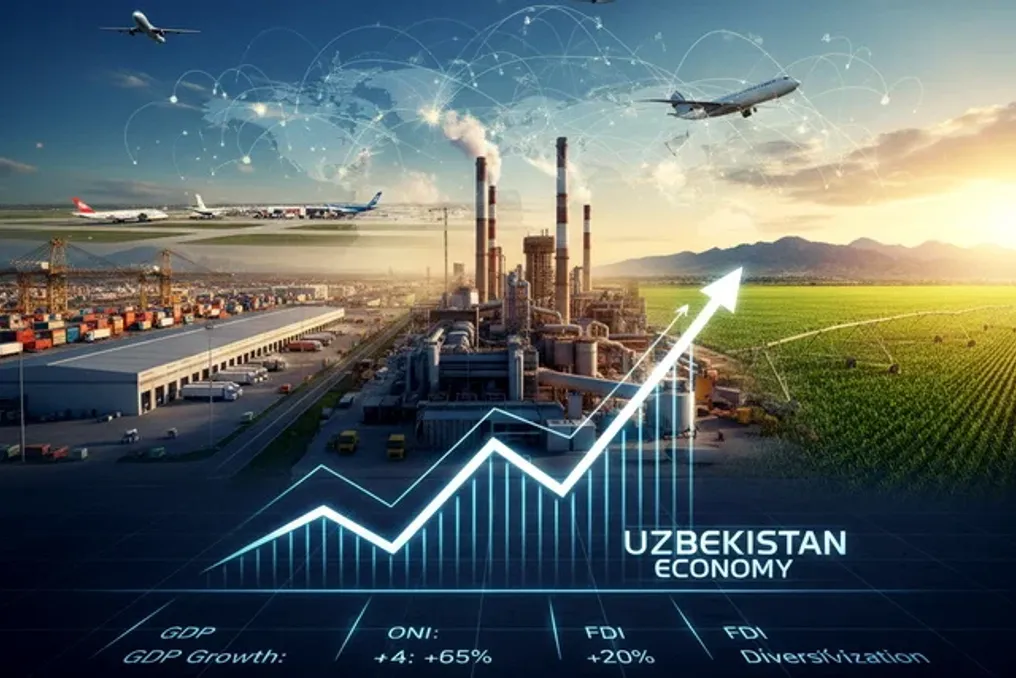
According to the National Committee of the Republic of Uzbekistan for Statistics, the volume of industrial production in Uzbekistan for the period from January to May 2026 amounted to 505.9 trillion soms at current prices. This demonstrates a growth of 7.9% compared to the same period last year.
Structure and Enterprises
As of June 1, 2026, there were 62,000 industrial enterprises operating in the country. The largest number of enterprises is concentrated in food production—12,400 units, which accounts for 20.0% of the total. Next are enterprises producing other non-metallic mineral products (8,700, or 14.0%) and clothing production (6,200, or 10.1%).
Significant contributions are also made by manufacturers of metal products (5,100, 8.2%), furniture (4,300, 6.9%), textiles (3,800, 6.1%), and producers of rubber and plastic products (2,900, 4.7%).
Regional Indicators
Among the regions, the largest volume of industrial production was recorded in Navoi region, where it reached 128,500.2 billion soms with a physical volume index of 105.2%. Tashkent city showed results of 81,663.0 billion soms (107.3%), and Tashkent region reached 80,029.6 billion soms (107.9%). Andijan region also demonstrated notable volumes with a figure of 44,049.7 billion soms and a growth of 109.3%.
Regarding the growth rates of physical production volume among regions, the leaders were Jizzakh region (112.1%), Samarkand region (109.5%), and Andijan region (109.3%), surpassing the average national index of 107.9%. The average annual industrial production per capita in the republic was 13.2 million soms, while the previous year it was 10.0 million soms. Above-average indicators were noted in Navoi region (115.4 million soms), Tashkent city (25.6 million soms), and Tashkent region (25.3 million soms).
Industry Structure and Raw Materials
Manufacturing industry dominates the structure of industrial production, accounting for 86.2% or 436.2 trillion soms, with a physical volume growth of 108.6%. Mineral extraction and quarrying provided 34.7 trillion soms (6.9%) with a growth of 106.3%. Electricity and gas supply accounted for 32.4 trillion soms (6.4%) with a growth of 103.7%, while water supply, sewerage, and waste management amounted to 2.7 trillion soms (0.5%) with a growth of 107.7%.
Within the manufacturing industry, 16.2% is attributed to the production of food, beverages, and tobacco products, and another 16.2% to the production of mechanical engineering products, including metal products, equipment, vehicles, and related repair work. Textiles, clothing, and leather goods accounted for 14.2%, while chemical products, rubber, and plastics made up 6.4%.
Resource Production
During the reporting period, the republic produced 15.8 billion cubic meters of natural gas, which is less than 18.4 billion cubic meters the previous year. Production also included 261,900 tons of oil (compared to 270,800 tons last year), 1.6 million tons of coal (compared to 2.5 million tons the previous year), 502,200 tons of motor gasoline, 476,400 tons of diesel fuel, 8.2 million tons of Portland cement (an increase from 7.8 million tons), 317,100 tons of yarn, and 630,400 tons of flour from soft wheat and spelt.
Automotive Industry and Energy
The output of automotive engines reached 103,293 units, exceeding last year's figure of 94,257 units. A total of 190,480 passenger cars were produced, compared to 171,211 units, as well as 2,413 trucks versus 1,873 units. Among passenger car models, Cobalt led with 69,302 units (an increase compared to 58,904), followed by Damas with 35,269 units (a decrease from 38,753). The output of BYD models notably increased to 10,120 units (compared to 5,495 the previous year), and Haval production increased to 4,038 units compared to 2,930.
The production of specialized vehicles grew to 23,791 units from 17,397 units. Electricity generation for January-May 2026 amounted to 36,167.3 million kWh, which is 3.1% more than last year. At the same time, large enterprise generation decreased to 24,812.5 million kWh from 26,316.5 million kWh the previous year, while small business generation increased to 11,354.8 million kWh from 8,747.7 million kWh, indicating an increased role of small businesses in energy.
Thermal Energy and Waste Management
Heat energy generation by large enterprises decreased by 17.4% to 8,429.8 thousand Gcal. Underground coal burning did not take place in 2026. In the water supply, sewerage, and waste management sector, the volume of wastewater treatment and removal services grew by 12.8% to 308.4 billion soms, and septic tank and cesspool cleaning services increased to 172.6 million soms. The volume of textile waste decreased by 0.6% to 10,300 tons.